Barcelona Activa
Product and technology for a unique tool
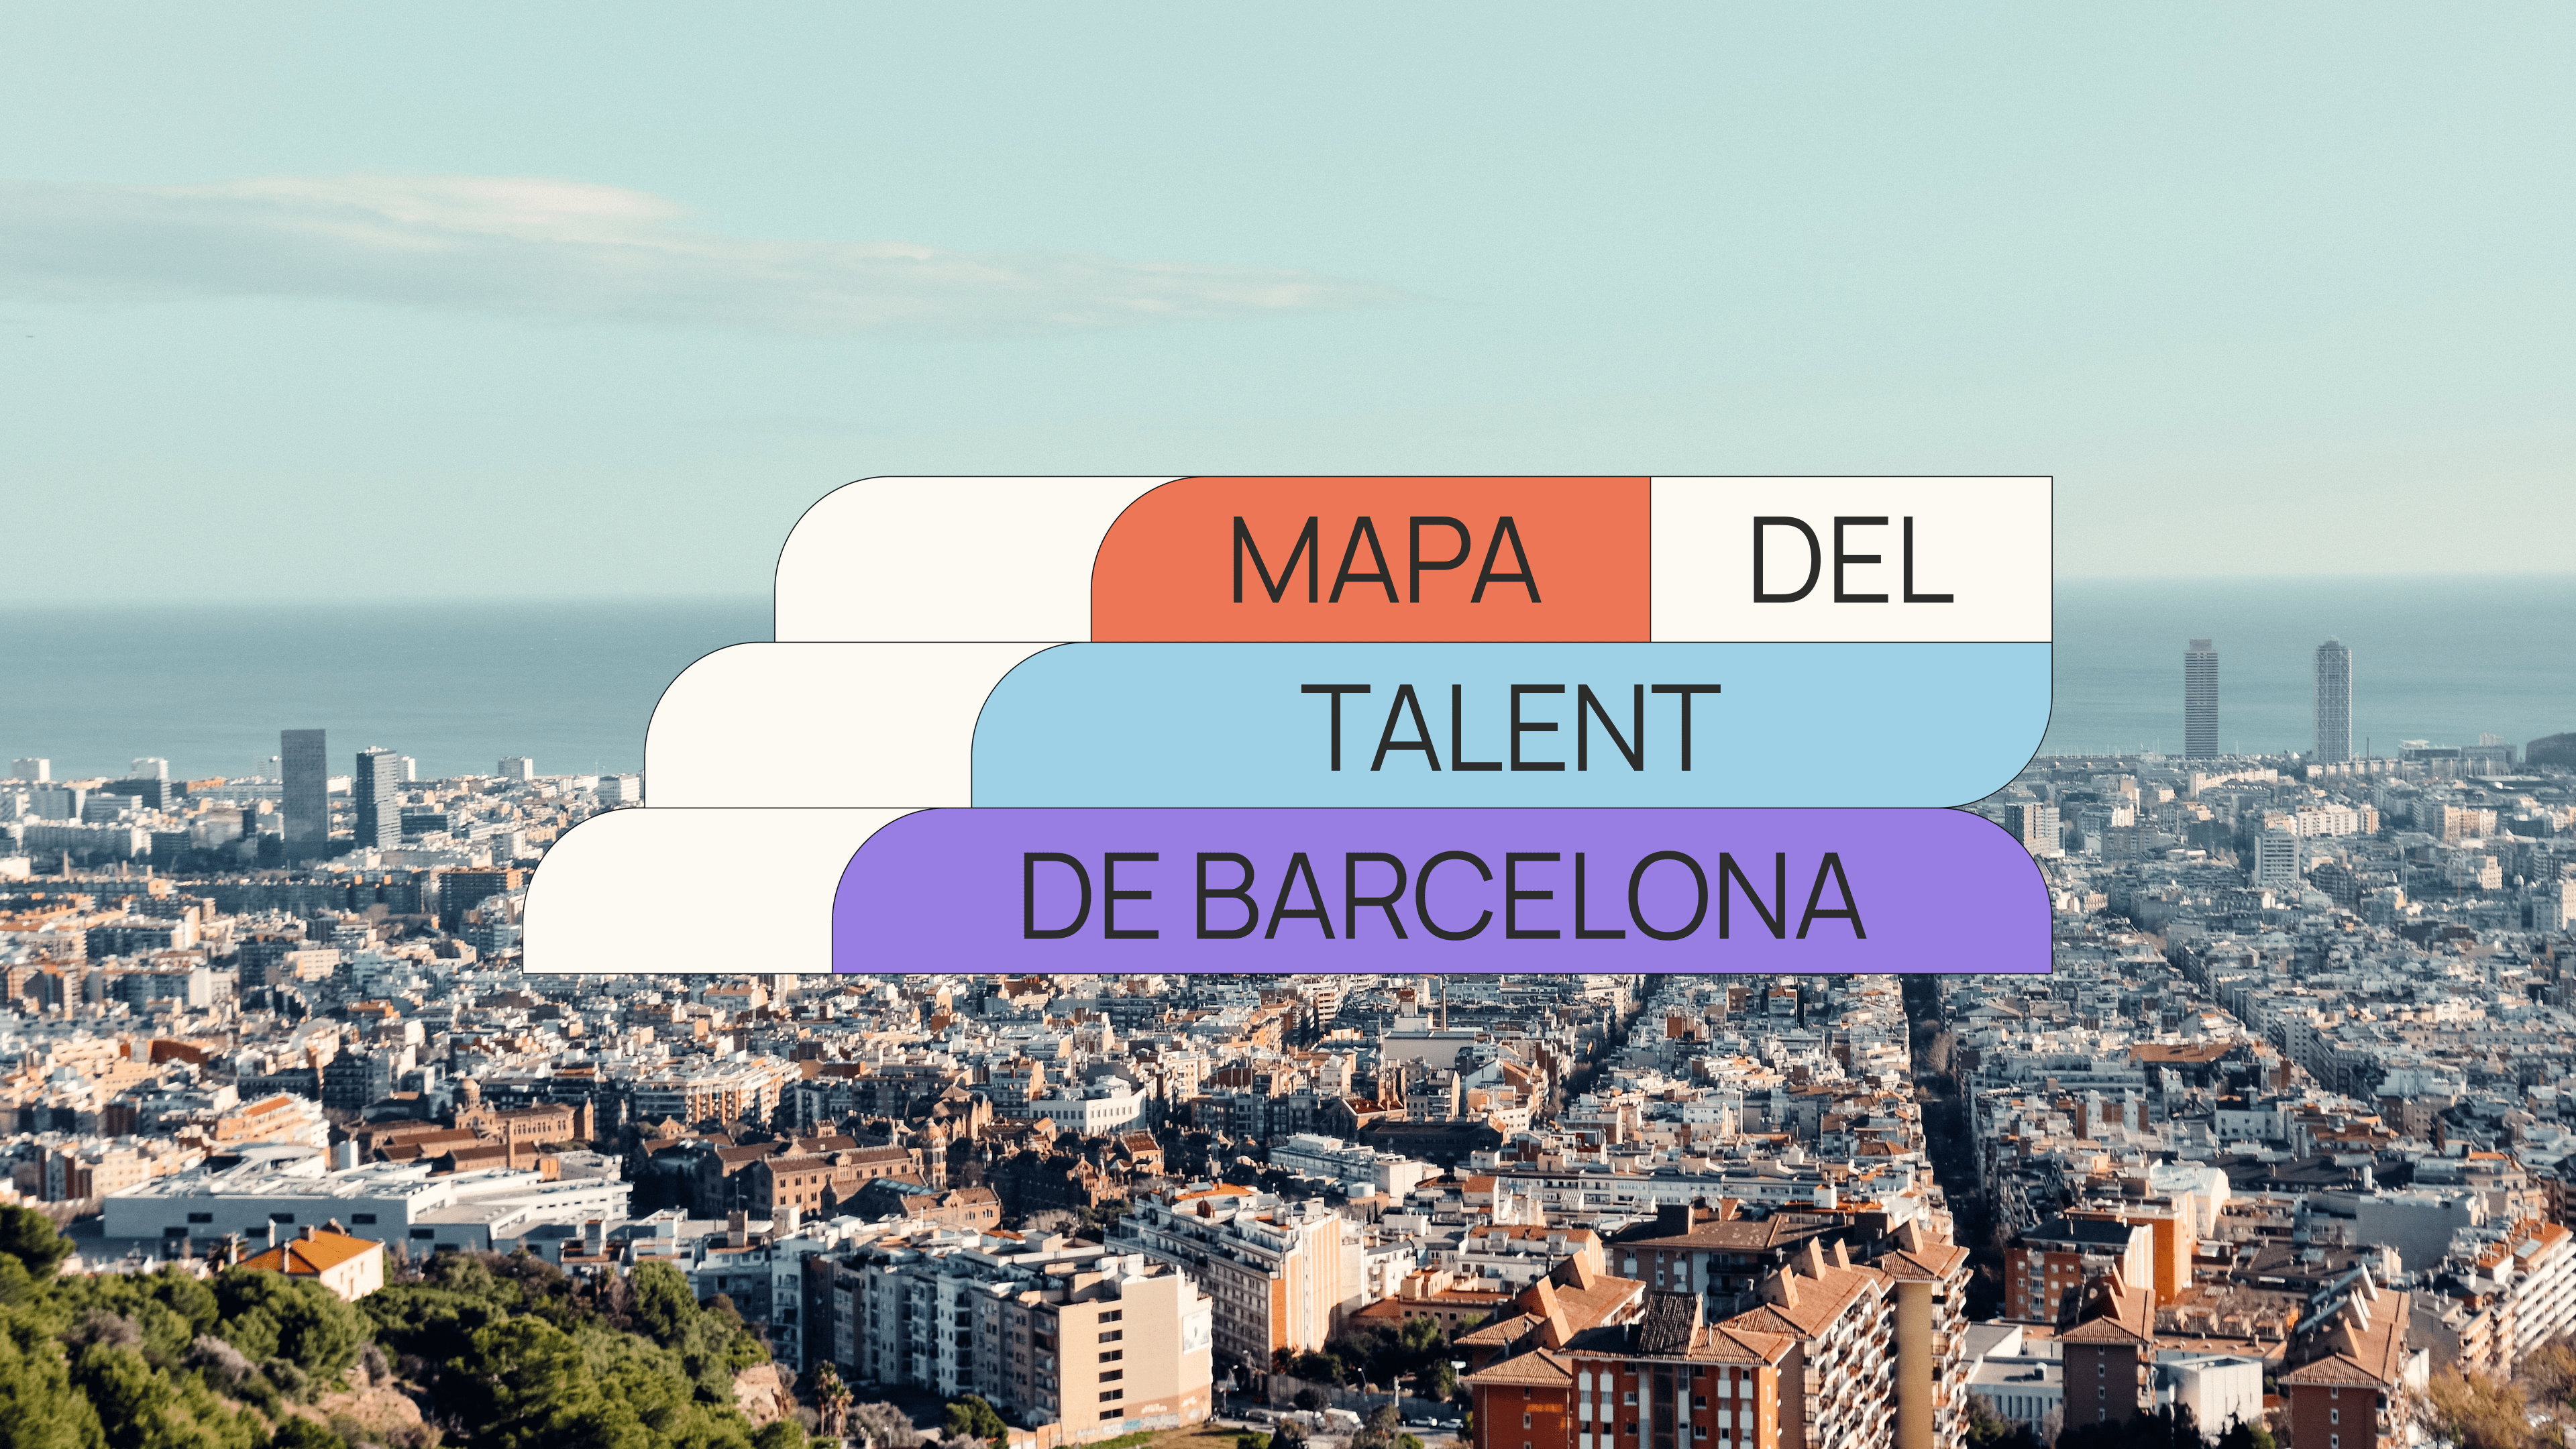
Barcelona Activa, the City Council's local development agency, approached Soluble towards the end of 2022 with the goal of developing a digital radiography of professionals in the city and surrounding area. They reached us through the Employment Map we created with Fundación Telefónica, and they sought our support to accomplish something "unusual.”
What was the challenge? Actually, there were several of them.
- 1.8 million data. LinkedIn contributed to the project by giving information about Barcelona talent in all of its forms.
- Making data visualization simple and easy to use. To accomplish so, we had to ingest and digest about 2 million records, comprehend the project's functional requirements, and design an informative and interactive digital tool.
- While maintaining visual impact. The graphical representation of the data had to be 'unique'.
- Is there anything else? We had one month to implement this technological challenge after receiving approval from all stakeholders involved.
To address all of these and bring the Talent Map to life, our Product Design and Technology teams joined forces.
DECISIONS THAT FOLLOW THE CONCEPT
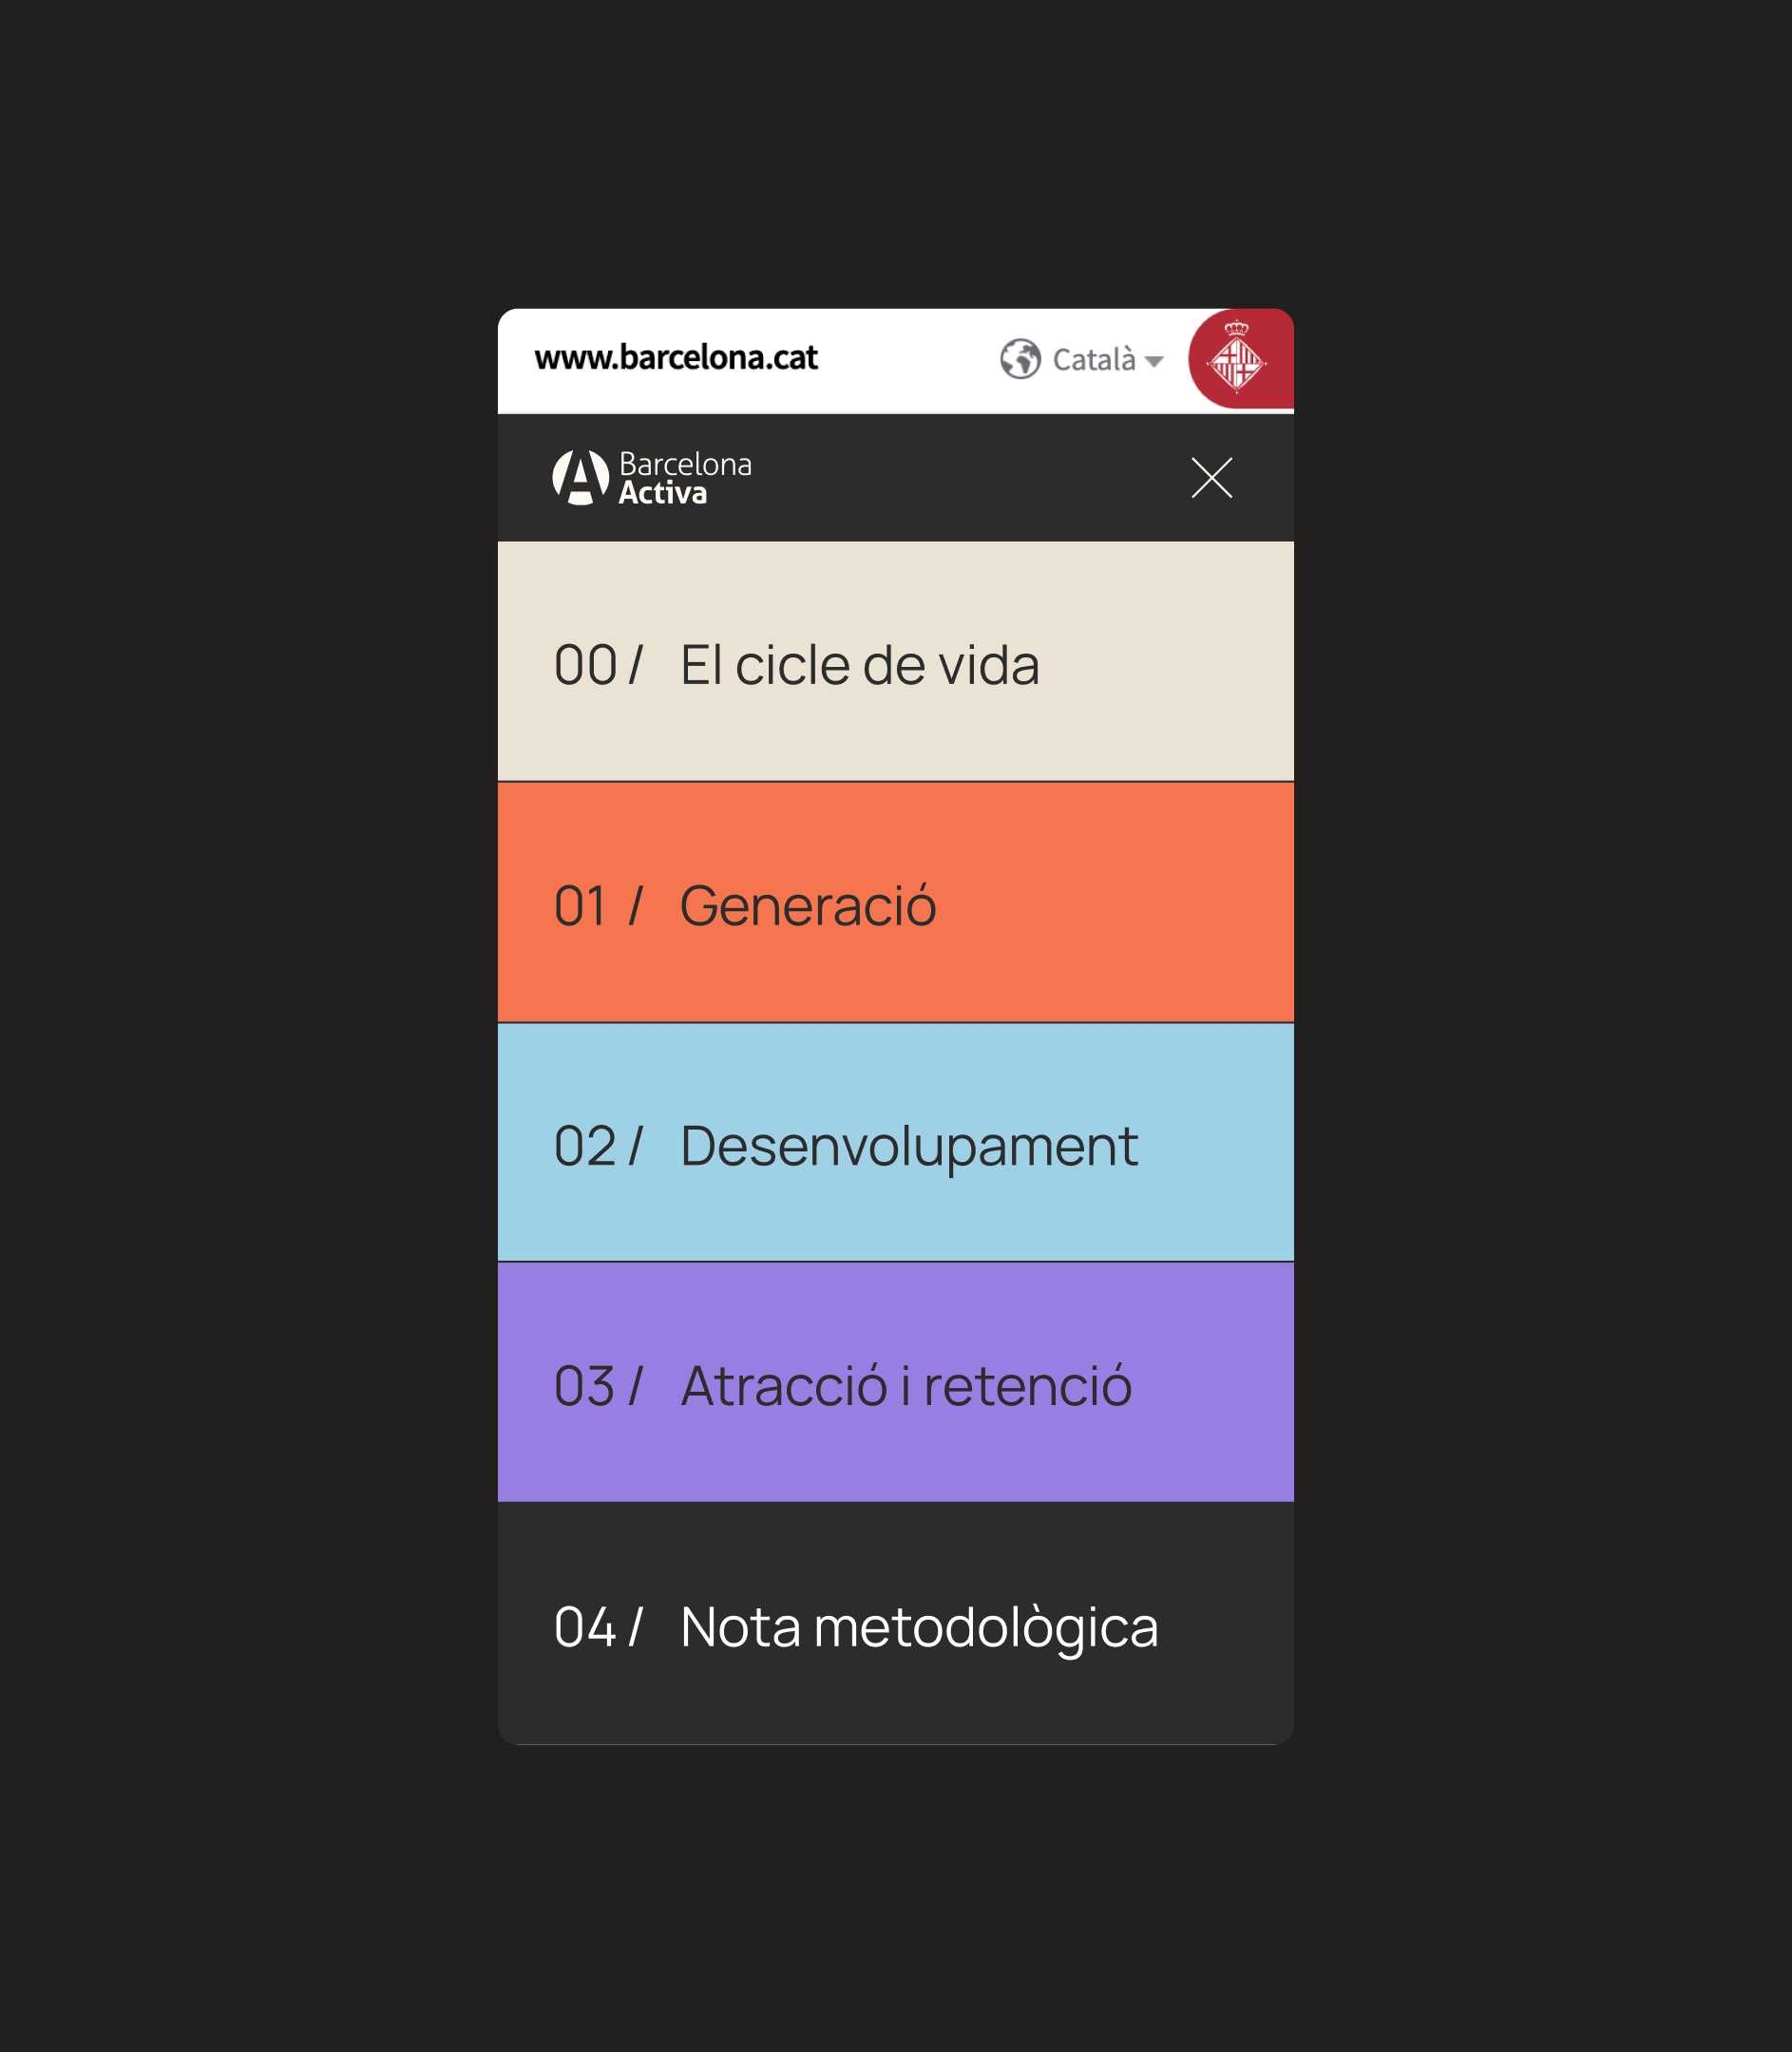
As usual, we began by examining the context. We immersed ourselves to comprehend the data and, as a result, determine the best approach to express it graphically. Barcelona Activa proposed a story to guide the navigation, the talent life cycle: generation, development, attraction, and retention. We needed something else to establish consistency and coherence across all of our platform development. We were lacking the creative concept that emerges from the strategy and leads all of our project decisions. So we started working on one.
***fila***
***columna***
***columna***

***fila***
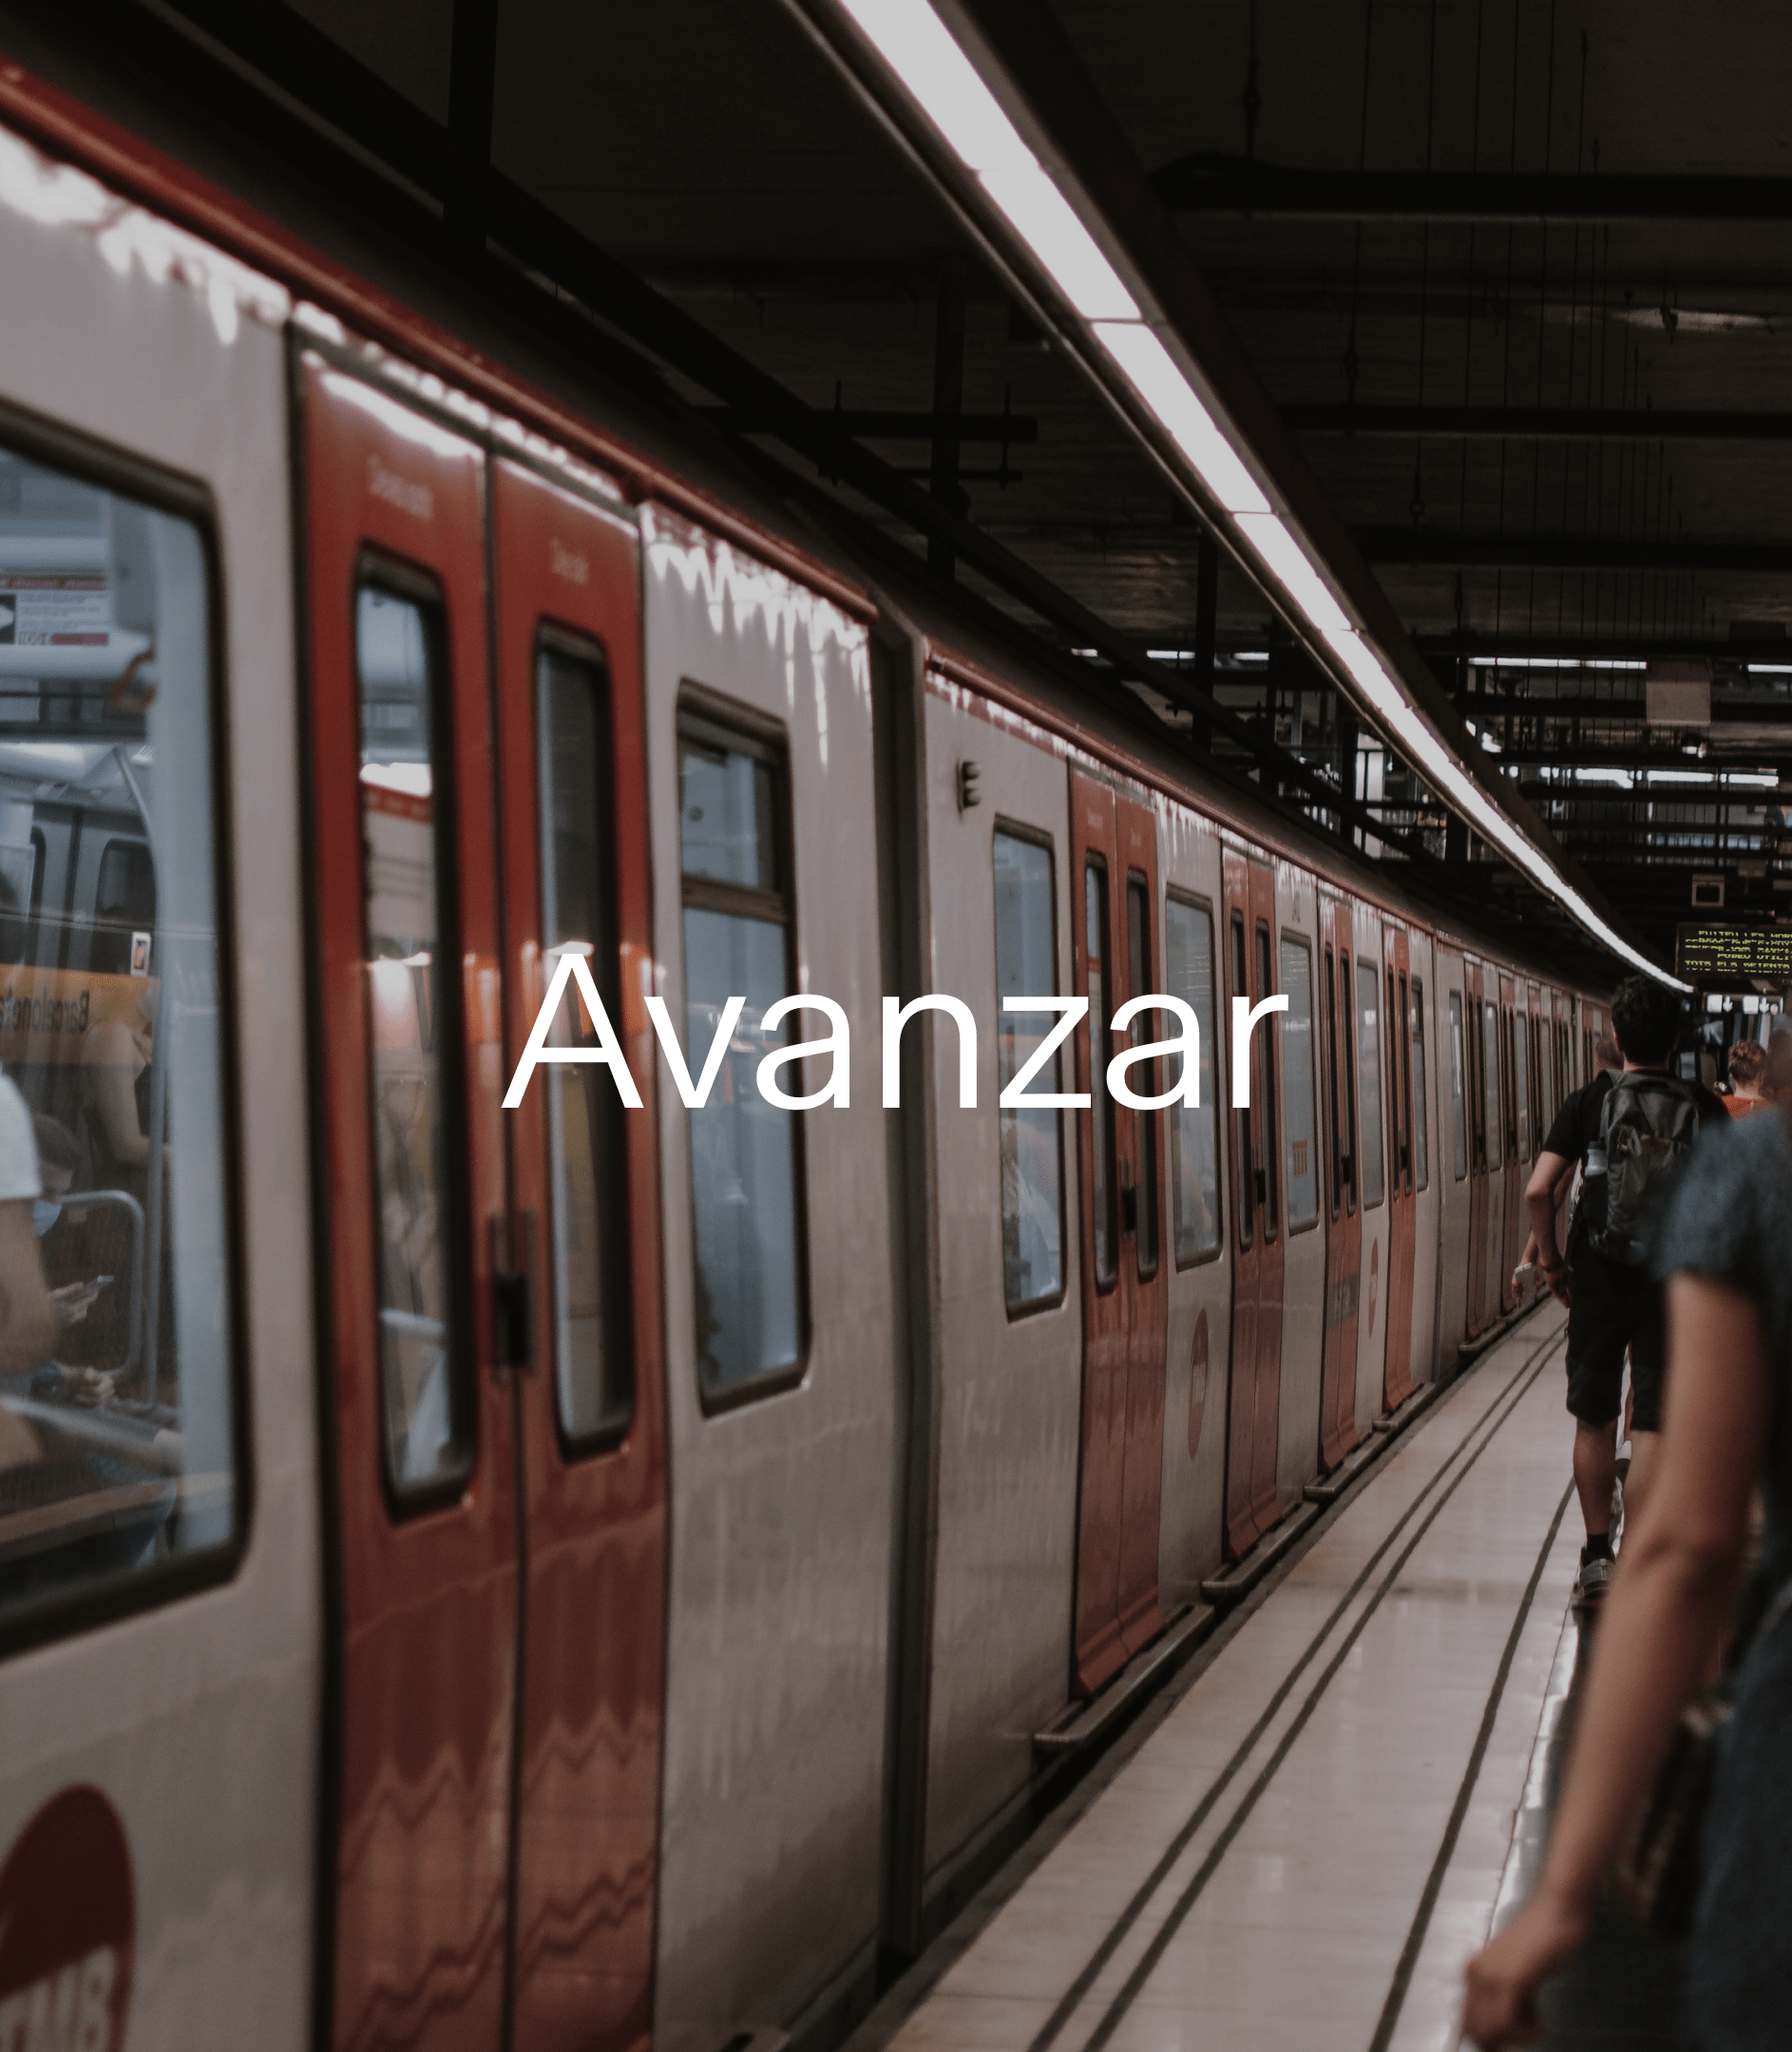
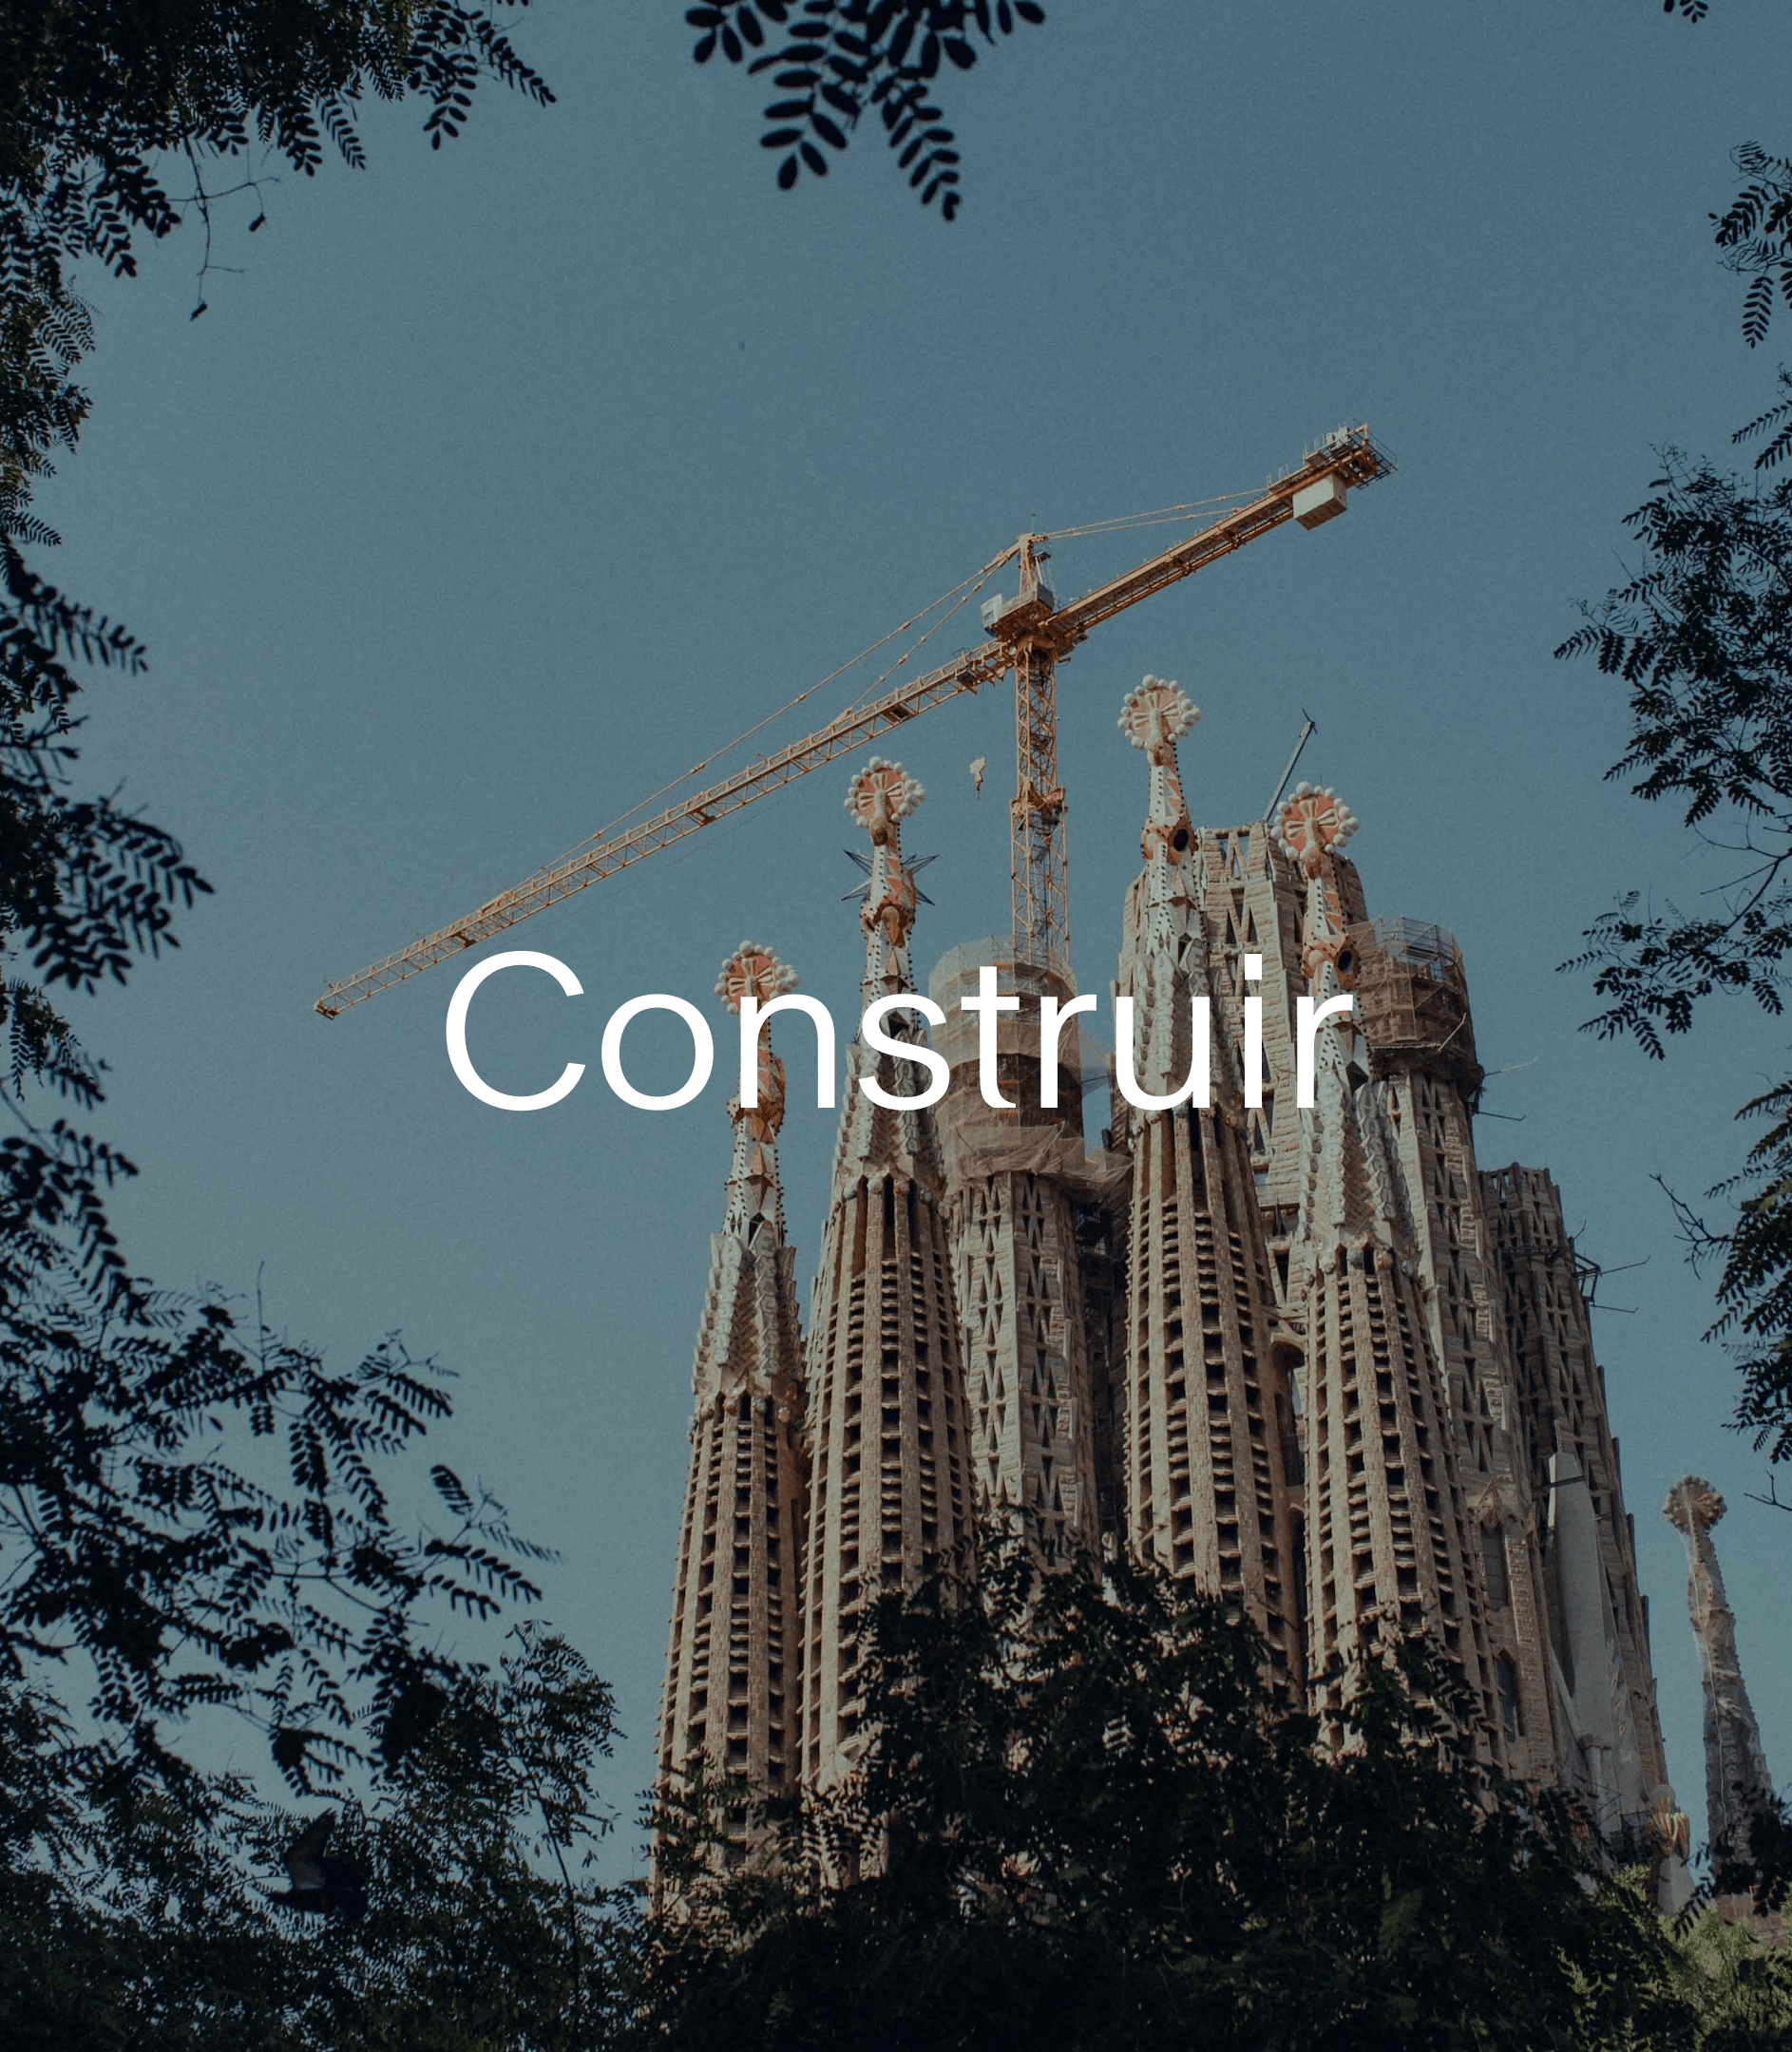
We found inspiration in the city itself, where much of the design team resides, and particularly in its public transportation system. We envisioned ourselves going across the city by subway and discovering features in continual development and progress, such as the Sagrada Familia, along the route. The color scheme for the different sections was inspired by the colors of the subway line and the rounded forms, with a staggered arrangement to keep moving forward, reminding us of Gaudí's work.
***fila***
***columna***
***columna***
***fila***
***fila***
***columna***
***columna***
***fila***
AMBITION AND AGILITY, THE DELICATE BALANCE
The selection of graphs to show this complicated data was critical to the project's success. We had to consider two constraints in our search: we were working with live graphics that would be changed, and time was pressing. We were able to provide an ambitious site, with a fast development and resource optimization, thanks to the use of a graphics library, D3, which is as powerful as it is complex. The joint effort of Design and Technology was required to assure the technical viability of design decisions and vice versa. It was pointless to select unique graphics if they were impossible to implement.
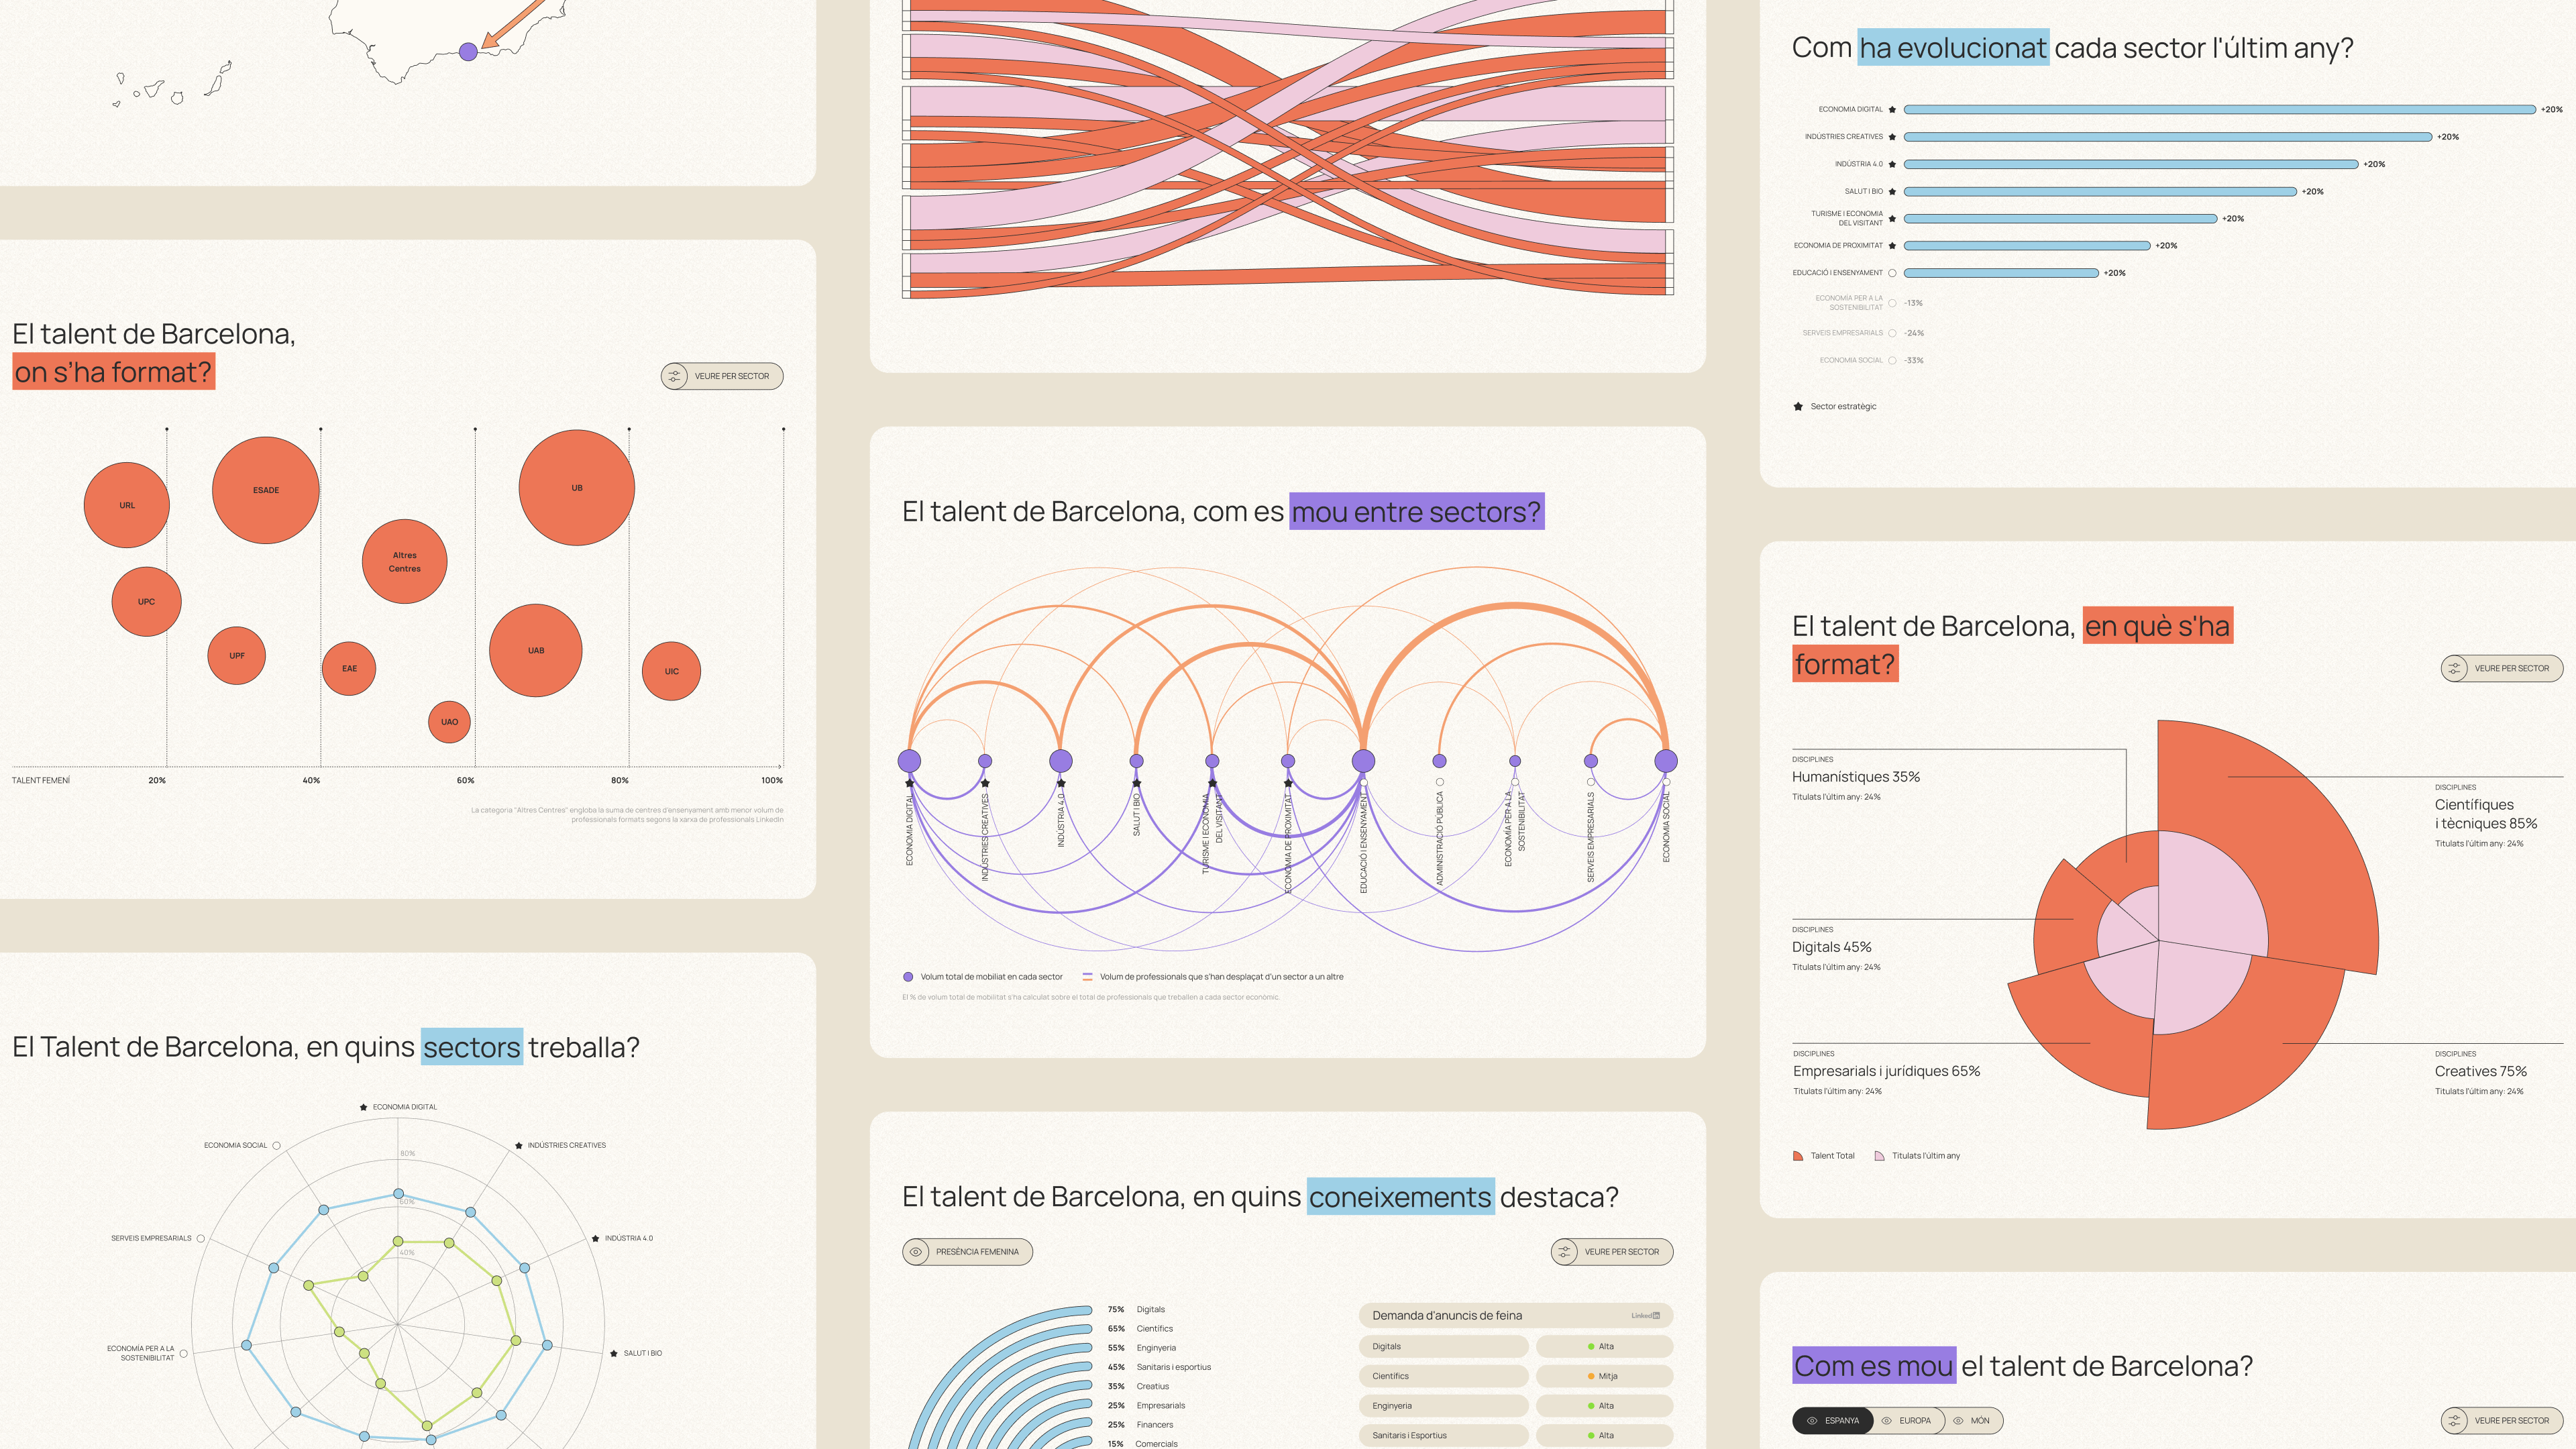
Thanks to the strategic decisions (and hours of study, testing and adapting the designs to the creative concept) we were able to create a universe of distinct graphics. Uniqueness: check.
We added interactions and micro-interactions to the data visualization to allow the user to review the information in an easy and personalized manner based on their interests. All of them, including the transition from one segment to the next, depict the progression of the talent's life cycle. Furthermore, the color palette that breathes Barcelona can be noticed in the hover, which changes to the primary color of each section, despite the fact that it's a single button at the programming level.
***fila***
***columna***
***columna***

***fila***
***fila***
***columna***
%20(1)%20(1)%20(1)_1_11zon.png)
***columna***
***fila***
TRIGONOMETRY TEST FOR THE TECH TEAM
Aside from these aspects that make the platform shine, Tech's involvement was critical from the start, since they collaborated with the Barcelona Activa Data team in establishing data structure (those 1.8 million records retrieved from LinkedIn). They, for one, used the R programming language to automate data extraction and analysis. We automated the retrieval and reading of data to paint the graphs so that if the records change or update, the graphs would automatically react. As a result, Barcelona Activa can update the information without our assistance.
%20(1)%20(1).png)
***fila***
***columna***
***columna***
***fila***
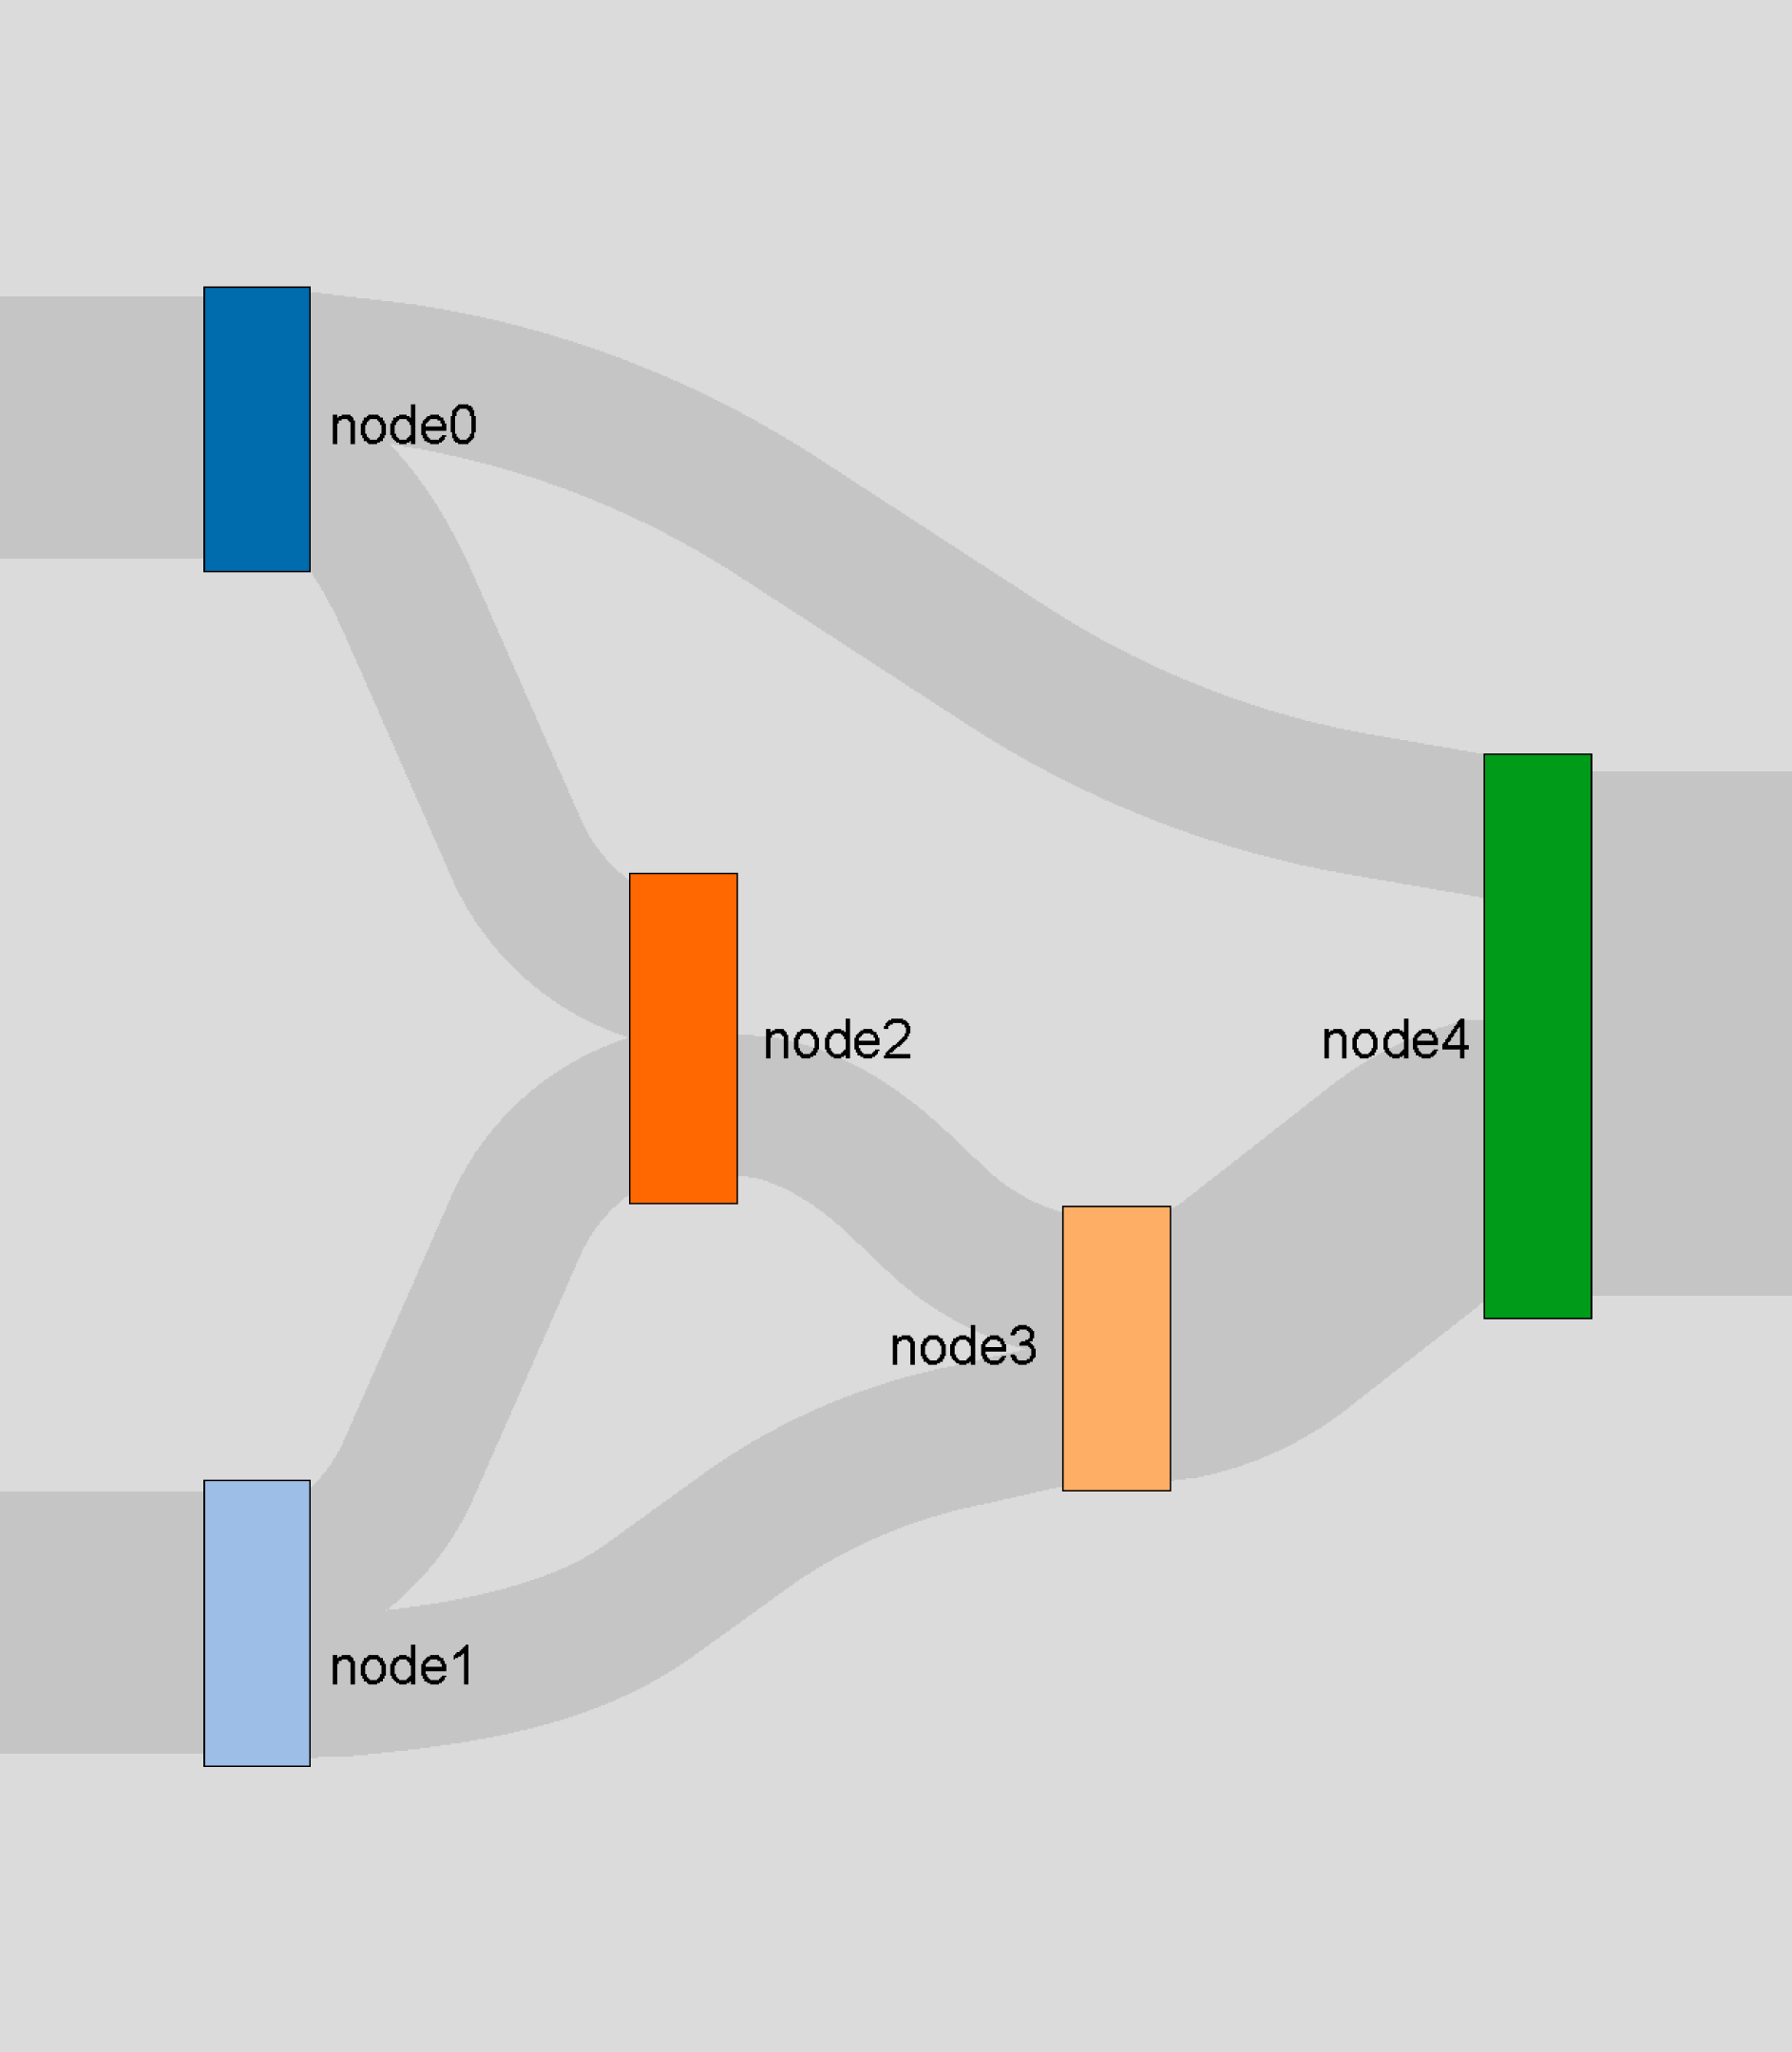
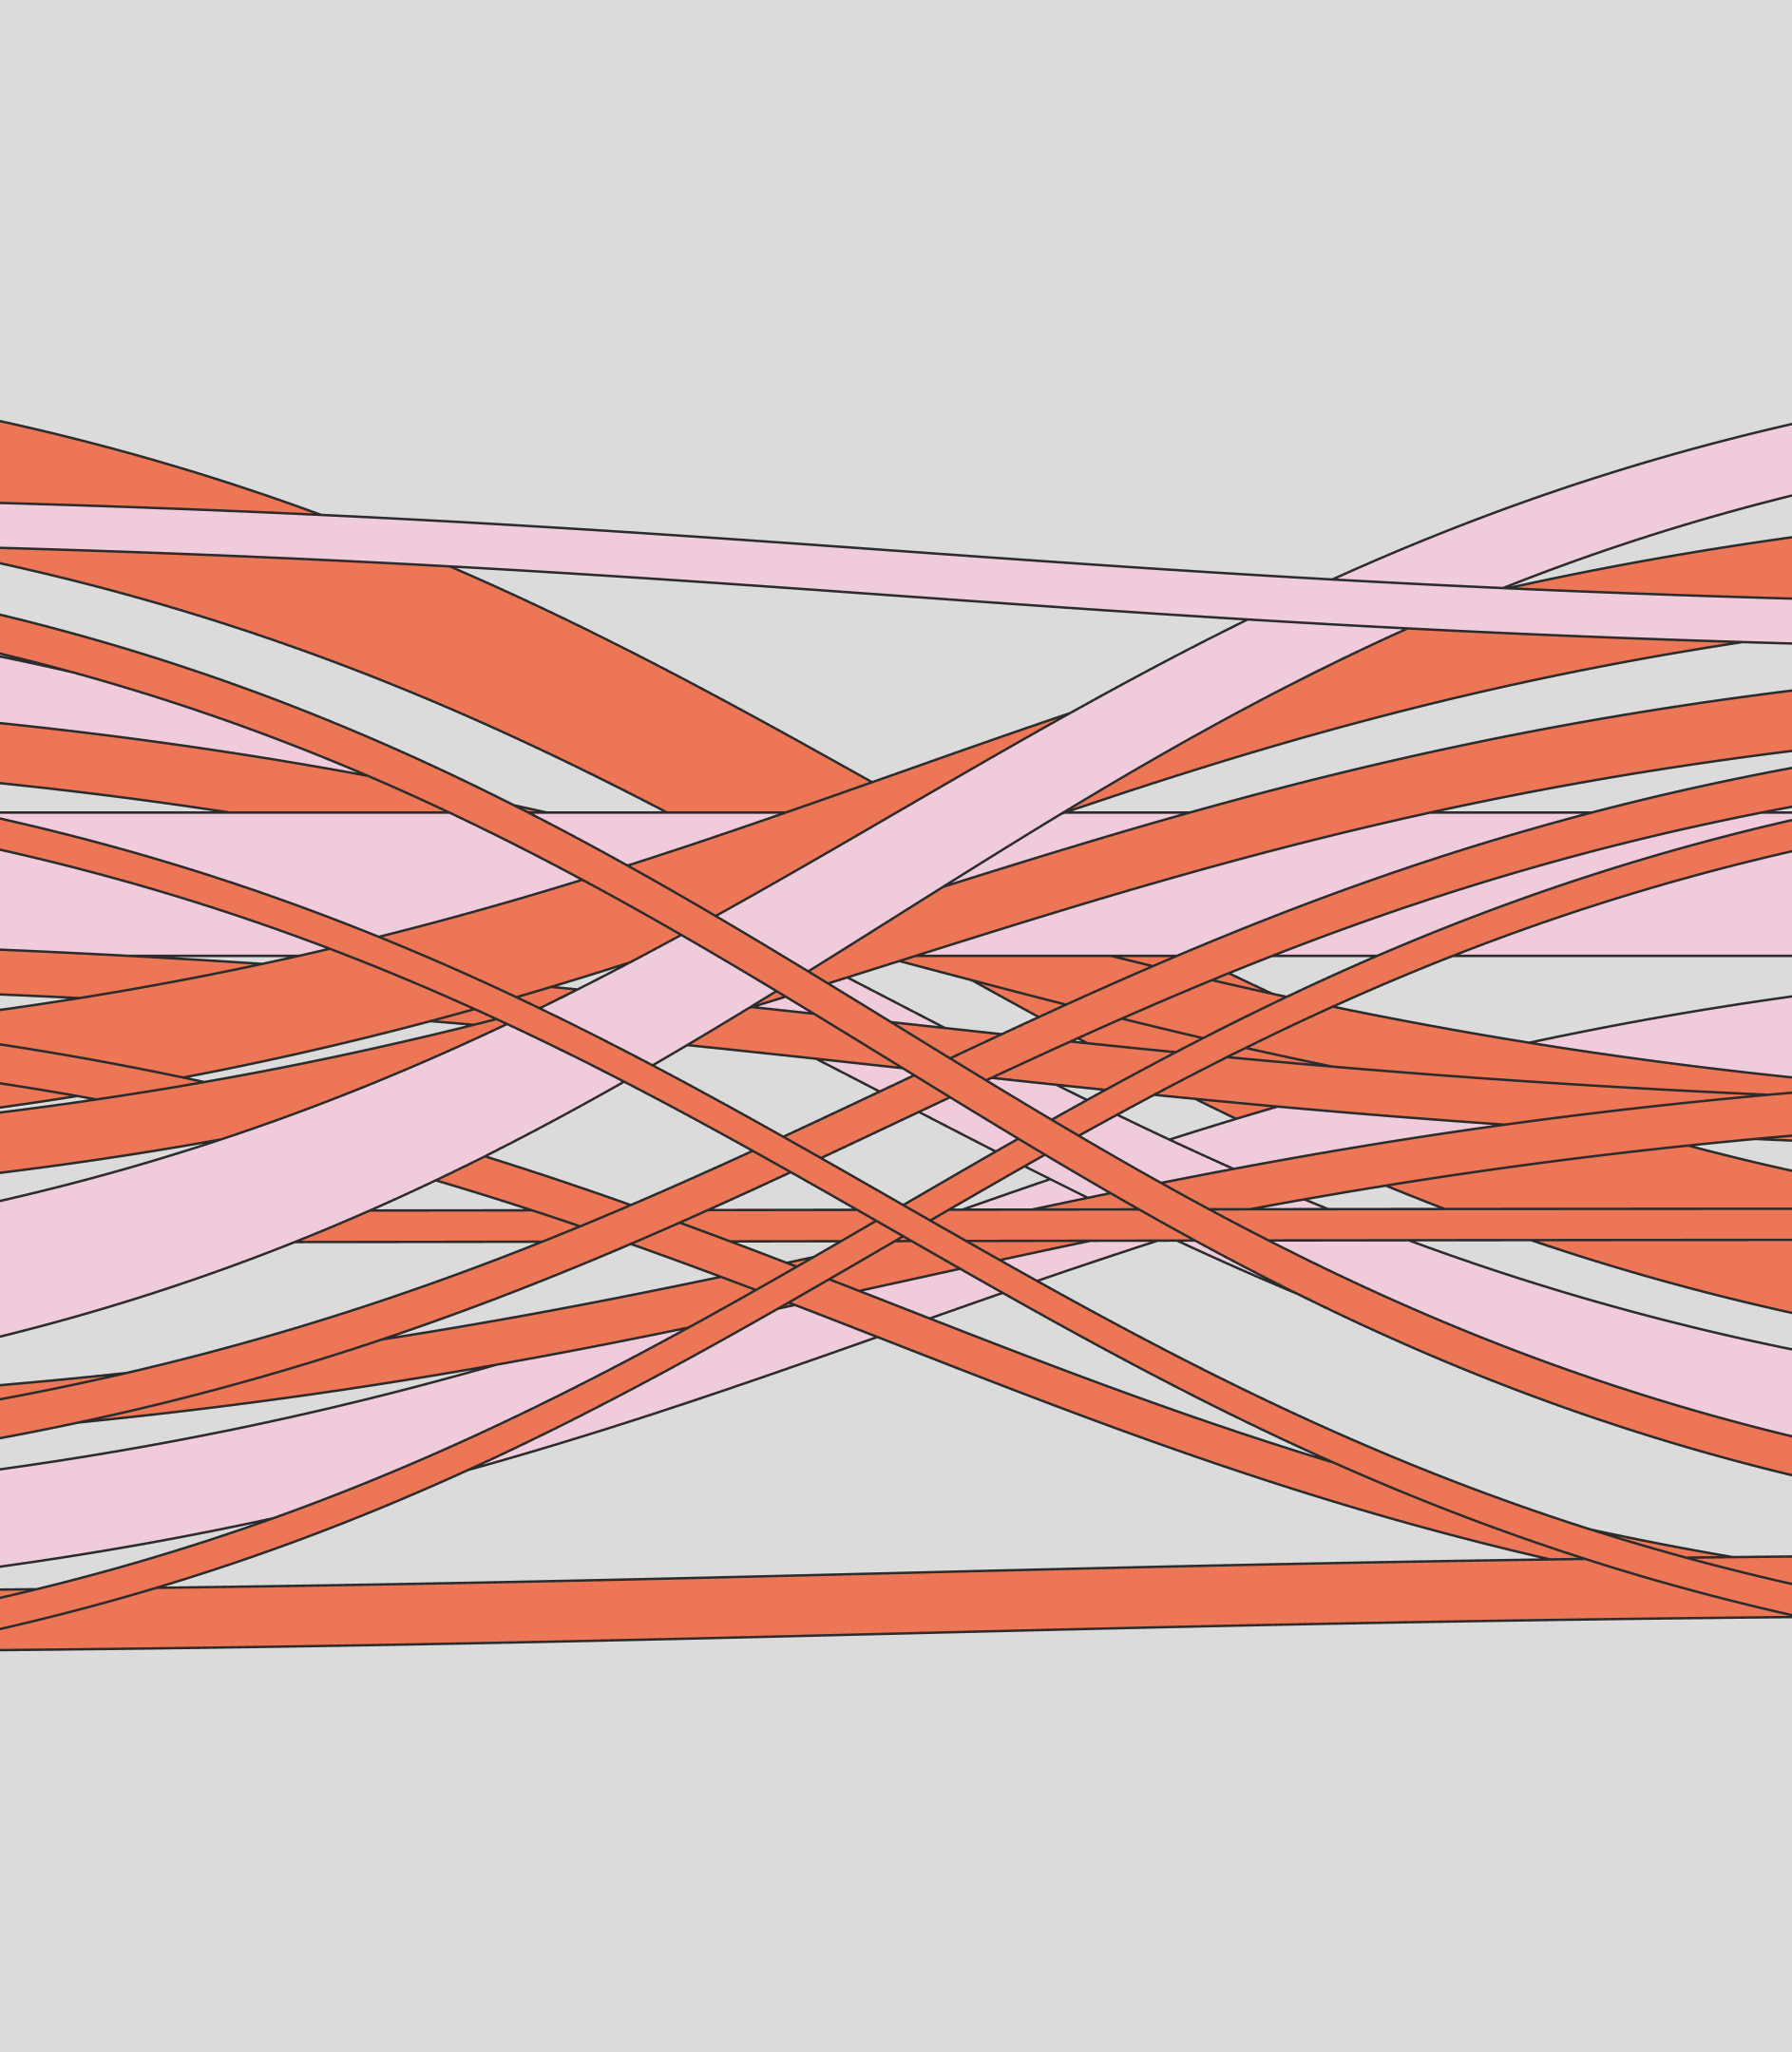
Understanding and managing the D3 library's complexity was also a technological challenge. We had to learn how to technically create the 8 graphs, and we relied on all of our resources to do it, from dusting off trigonometry school notes to leaning on ChatGPT.
THE OUTCOME
Without question, this has been one of those projects that not only inspires us, but also makes us grow and improve at our work. We couldn't have asked for anything more.

Oh, and let's not forget about the outcome. Have we conquered the difficulties presented by this Talent Map? "Thanks to the Soluble team, we have achieved our challenge: to show the behavior of Barcelona's talent through a unique tool that is friendly and simple for users," explains Sara Díaz Roig, head of Digital Talent Promotion at Barcelona Activa. Now all we need is your feedback, so please let yourself be guided by our map.

Grupo Doorcats
The challenge
Streamline the naming structure (Grupo Doorcats, Los Gatos, Doorcats) to accurately communicate its extensive offering and connect with each audience.
The solution
New hybrid architecture with a parent brand and two service brands (Los Gatos and Doorcats), an identity based on "roots," and a corporate landing page.
Grupo Doorcats
The challenge
Build a brand reflecting its expertise, extensive range, and close family service in carpentry and hardware for professionals and the public.
The solution
Evolution of its historic cat emblem, a color redesign (green and orange), and a website with clear UX that brings advice to the digital realm.
Grupo Doorcats
The challenge
Build an independent brand from the ground up to showcase the value of high-end carpentry and co-creation to architects and interior designers.
The solution
Elegant identity featuring a typographic logo, an abstract emblem (D+G), a neutral palette, and a portfolio-style website with an editorial focus.
Plenit
The challenge
Propelling Jotelulu with an international brand that reflects its evolution from a cloud provider to an operational platform for the IT channel.
The solution
Creating Plenit: a strategic, verbal, visual, animated, and digital brand to express its new scale to the IT channel.
SCImago
The challenge
Highlighting the true value of SIR as an evidence-based diagnostic tool and communicating the public availability of its 20 indicators.
The solution
An evolution of the brand platform's narrative and visual identity, along with a website optimized for filtering and querying a high volume of data.