NTT Data
Transforming a report into an experience of knowledge
.jpg)
.png)
In over 50 countries and among the top 10 IT service companies, we find NTT Data. Every year, this technology consultancy releases the Insurtech Global Outlook Report, a compilation of the industry's most significant data, insights, and learnings, made possible by months of dedication and hard work.
After six editions, they wanted to transform their report into something more than knowledge: an experience capable of being a source of knowledge and know-how in the complex, competitive and ever-disruptive arena occupied by technology. We already shared how we developed a strategy to guide the following steps: creating a verbal and visual identity to set the image we were seeking for the report, as well as establishing the stages to complete this evolution towards being a comprehensive experience of knowledge about the insurtech sector through a Service Design exercise.
360 ACTIVE LISTENING
In the first phase –of definition and analysis of the market and other reports with similar characteristics– it was essential to understand the reality of those who had to work with Insurtech Global Outlook and to know in depth their context, habits, points of contact and the details surrounding their consumption of the report.
We held seminars within NTT Data to better understand the report's preparation process and to identify the team's most important pain points. We also interviewed those professionals within the company who had to use the report as a tool for work and conversation with stakeholders.
To round out the picture, we spoke with the end users of this information, who were largely profiles in the C-Levels of big and medium-sized firms with limited time and in different areas of the world.
SAME INFORMATION, DIFFERENT CONSUMPTION STYLES, MORE ACCESSIBILITY
We knew what the original report experience looked like, and we had the data and insights, as the NTT Data team focused their report on the five major challenges the industry is experiencing, the ones that are establishing new lines of business and reshaping their sector. They served as our guidance in developing a content structure that made the report easy to read, organizing these important subjects and their information to allow visitors to skip right to the content that provides them the greatest value.
Now, we had to be bold with how to expose them in order to turn the report into a digital tool capable of adapting to each reading and consuming style, as well as designing actions from a systemic, creative and people-centered approach.
It was the only way to respond to everything we had identified and ensure that the strategy and the visual and verbal identities could be developed effectively while adhering to a non-negotiable: not losing a single grain of the data and analysis value.
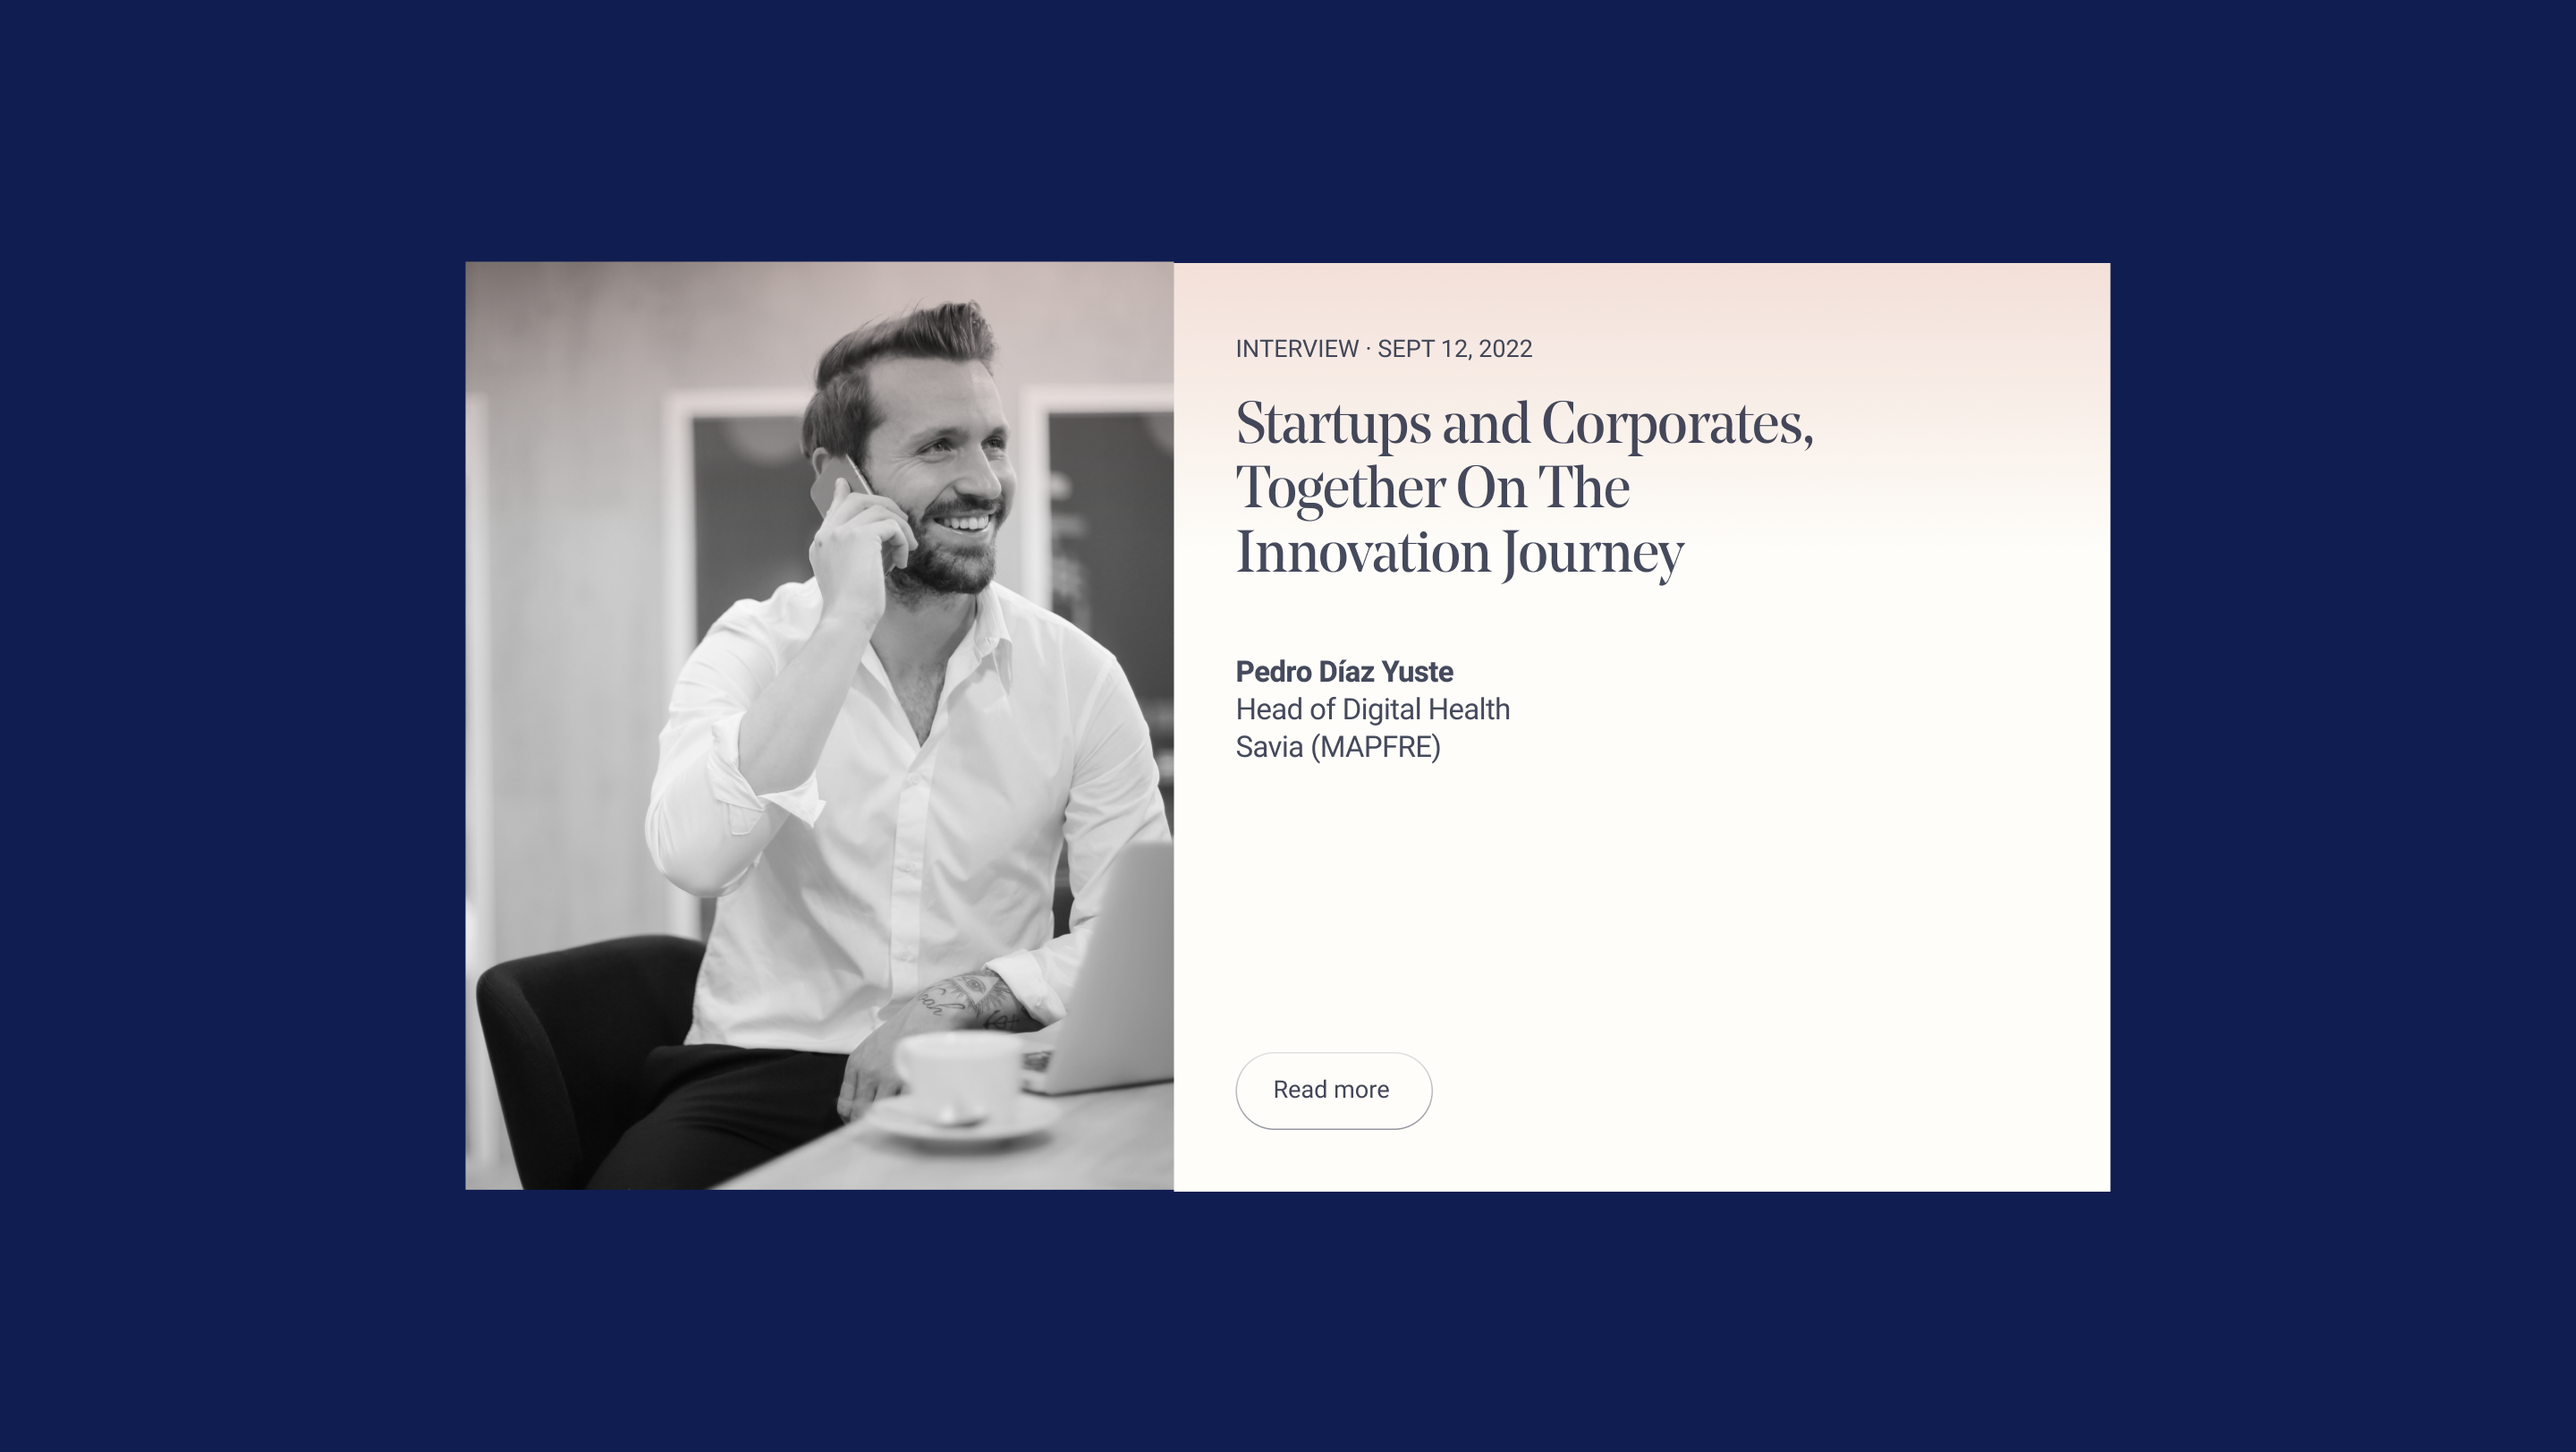
In order to convert it into accessible information, we made decisions guided by two tools: well-defined User Personas and the evolution of the experiential journey with Insurtech Global Outlook. This helped us not to lose sight of the importance of prioritizing the information based on the needs detected, as well as translating the content into the same language and codes that they understood.
.png)
VISUALIZING THE DATA
We developed the report with two goals in mind: to make it easy for the reader to consume the information and to entice him or her to learn more about it. To do this, we sought a formula that would allow us to present the most important information in a visually simple and appealing manner, always emphasizing on clarity in a format that puts the user first.
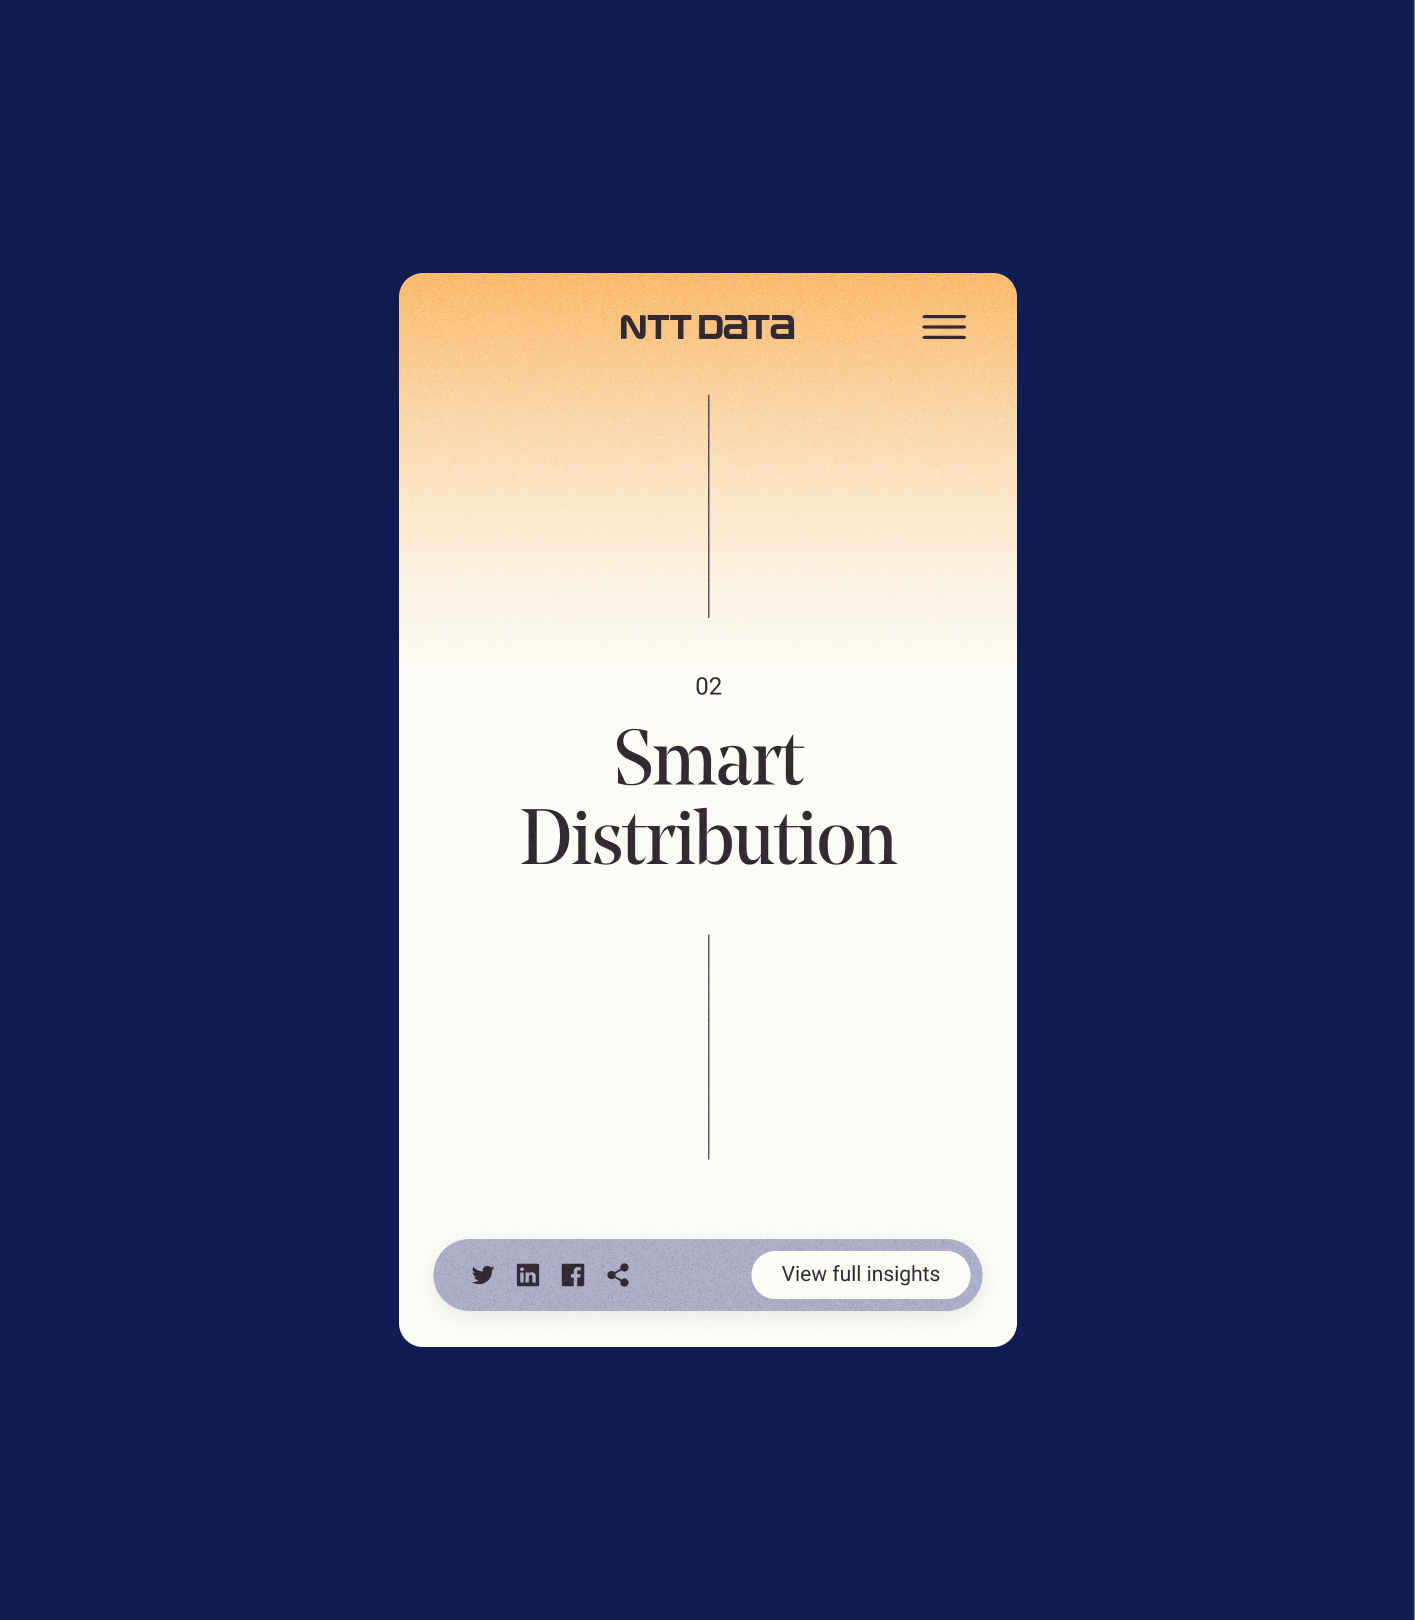
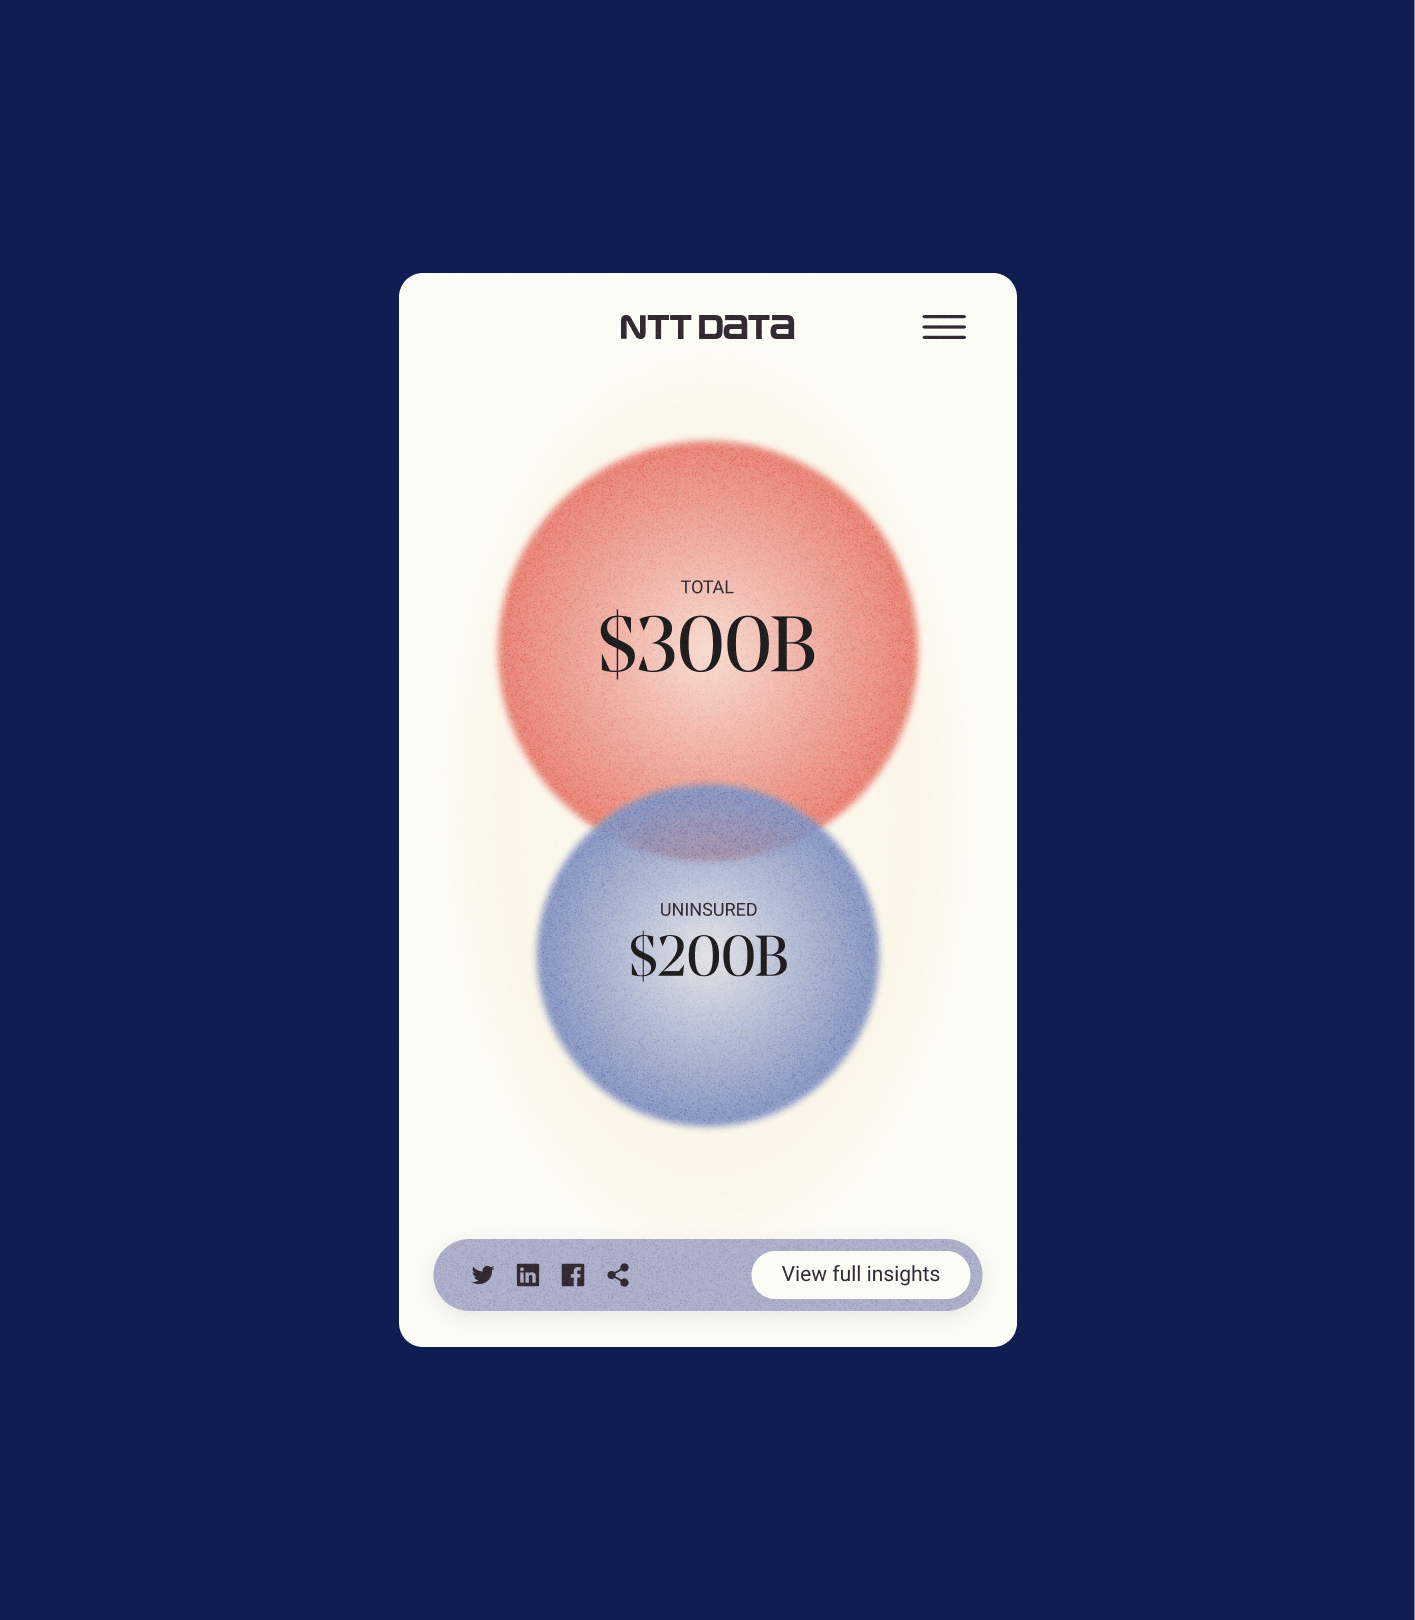
Thus was born the visualization system, to interpret the high volume of data we were going to use and translate it into graphs or maps that were almost intuitive for the reader. The system had to be rich enough to not bore, simple to be understood, and elegant to match the narrative we wanted to convey.
For this reason, over the more than 300 pages of the different reports, nearly 100 different graphs were built, based on almost a dozen typologies that were tailored to each sort of information.
.png)
REFINING THE INSIGHT
Another critical component was to turn the results into brief and clear insights that would convey and explain what the data was communicating at the right time of reading. All of them, once again, written with the person receiving the report in mind rather than the one writing it.
***fila***
***columna***
***columna***
***fila***
INTUITIVE, SIMPLE AND CUSTOMIZED NAVIGATION
Beyond the report itself, it was essential to rethink and redesign - as well as build - a landing page that also responded to all that had been learned during the process, to all that had been worked on during the strategy and design stages.
We made a clear commitment to reading comfort, served in a dual format: vertical (with scroll) and horizontal (as a slide). Thus, the tool allows the report to be viewed in two different ways, depending on the level of depth desired by the user.
ENABLING TECHNOLOGY
And as if there were not enough challenges throughout the project, the digital part of the report had to be easily integrated into NTT Data's own website and meet all of its security, positioning and synergy needs while taking into account the ease - and happiness - of its internal technical team.
Communication and synchronous work between teams were critical for Soluble's Tech area to implement a strategy that allowed them to fully adapt to NTT Data workflow and tools, for which it was necessary to develop simultaneously in different environments to gain freedom of construction on the platform.
It was also necessary to take into account the complexity of the design and construction of the multiple templates that were created to display the report as slides. The Tech team came up with a flexible structure that could adapt to the different forms, easily editable from DatoCMS.
From the beginning, both teams coordinated to define and ensure the consistency of all technical aspects, such as the use of forms. Constant communication was key to develop and update code in perfect synchrony. Thus, when it was time to bring all the development together and go into production, success was assured.
QUADRUPLE THE NUMBER OF DOWNLOADS
We spent months working hand in hand with the NTT Data team, not only with the team in charge of developing the Insurtech Global Outlook content, but also with the Technology, Marketing and Communication teams with whom we built a fluid and enriching relationship throughout the process.
Six months following the international launch, we could see that their instincts in turning the report into an experience were correct. The aim of doubling the amount of downloads over the previous year was not only met, but it actually multiplied by four.
***fila***
***columna***
***columna***
***fila***
THE SUCCESS OF COMPLEMENTARY HOLISTIC
This milestone would not have been possible without the holistic vision and the hand-in-hand work with the internal team that Richard Calvo valued at the end of the project: "What we value most about Soluble is its close, flexible DNA and great empathy with the work teams, which results in multiplying the value of the projects in which we collaborate with them".
In one of our last conversations, we were delighted to see how even with this year's very good results, the NTT Data team came up with ideas to improve the upcoming edition. And when faced with a challenge, we can't stand still. So every report a challenge, every project the same passion.

Grupo Doorcats
The challenge
Streamline the naming structure (Grupo Doorcats, Los Gatos, Doorcats) to accurately communicate its extensive offering and connect with each audience.
The solution
New hybrid architecture with a parent brand and two service brands (Los Gatos and Doorcats), an identity based on "roots," and a corporate landing page.
Grupo Doorcats
The challenge
Build a brand reflecting its expertise, extensive range, and close family service in carpentry and hardware for professionals and the public.
The solution
Evolution of its historic cat emblem, a color redesign (green and orange), and a website with clear UX that brings advice to the digital realm.
Grupo Doorcats
The challenge
Build an independent brand from the ground up to showcase the value of high-end carpentry and co-creation to architects and interior designers.
The solution
Elegant identity featuring a typographic logo, an abstract emblem (D+G), a neutral palette, and a portfolio-style website with an editorial focus.
Plenit
The challenge
Propelling Jotelulu with an international brand that reflects its evolution from a cloud provider to an operational platform for the IT channel.
The solution
Creating Plenit: a strategic, verbal, visual, animated, and digital brand to express its new scale to the IT channel.
SCImago
The challenge
Highlighting the true value of SIR as an evidence-based diagnostic tool and communicating the public availability of its 20 indicators.
The solution
An evolution of the brand platform's narrative and visual identity, along with a website optimized for filtering and querying a high volume of data.