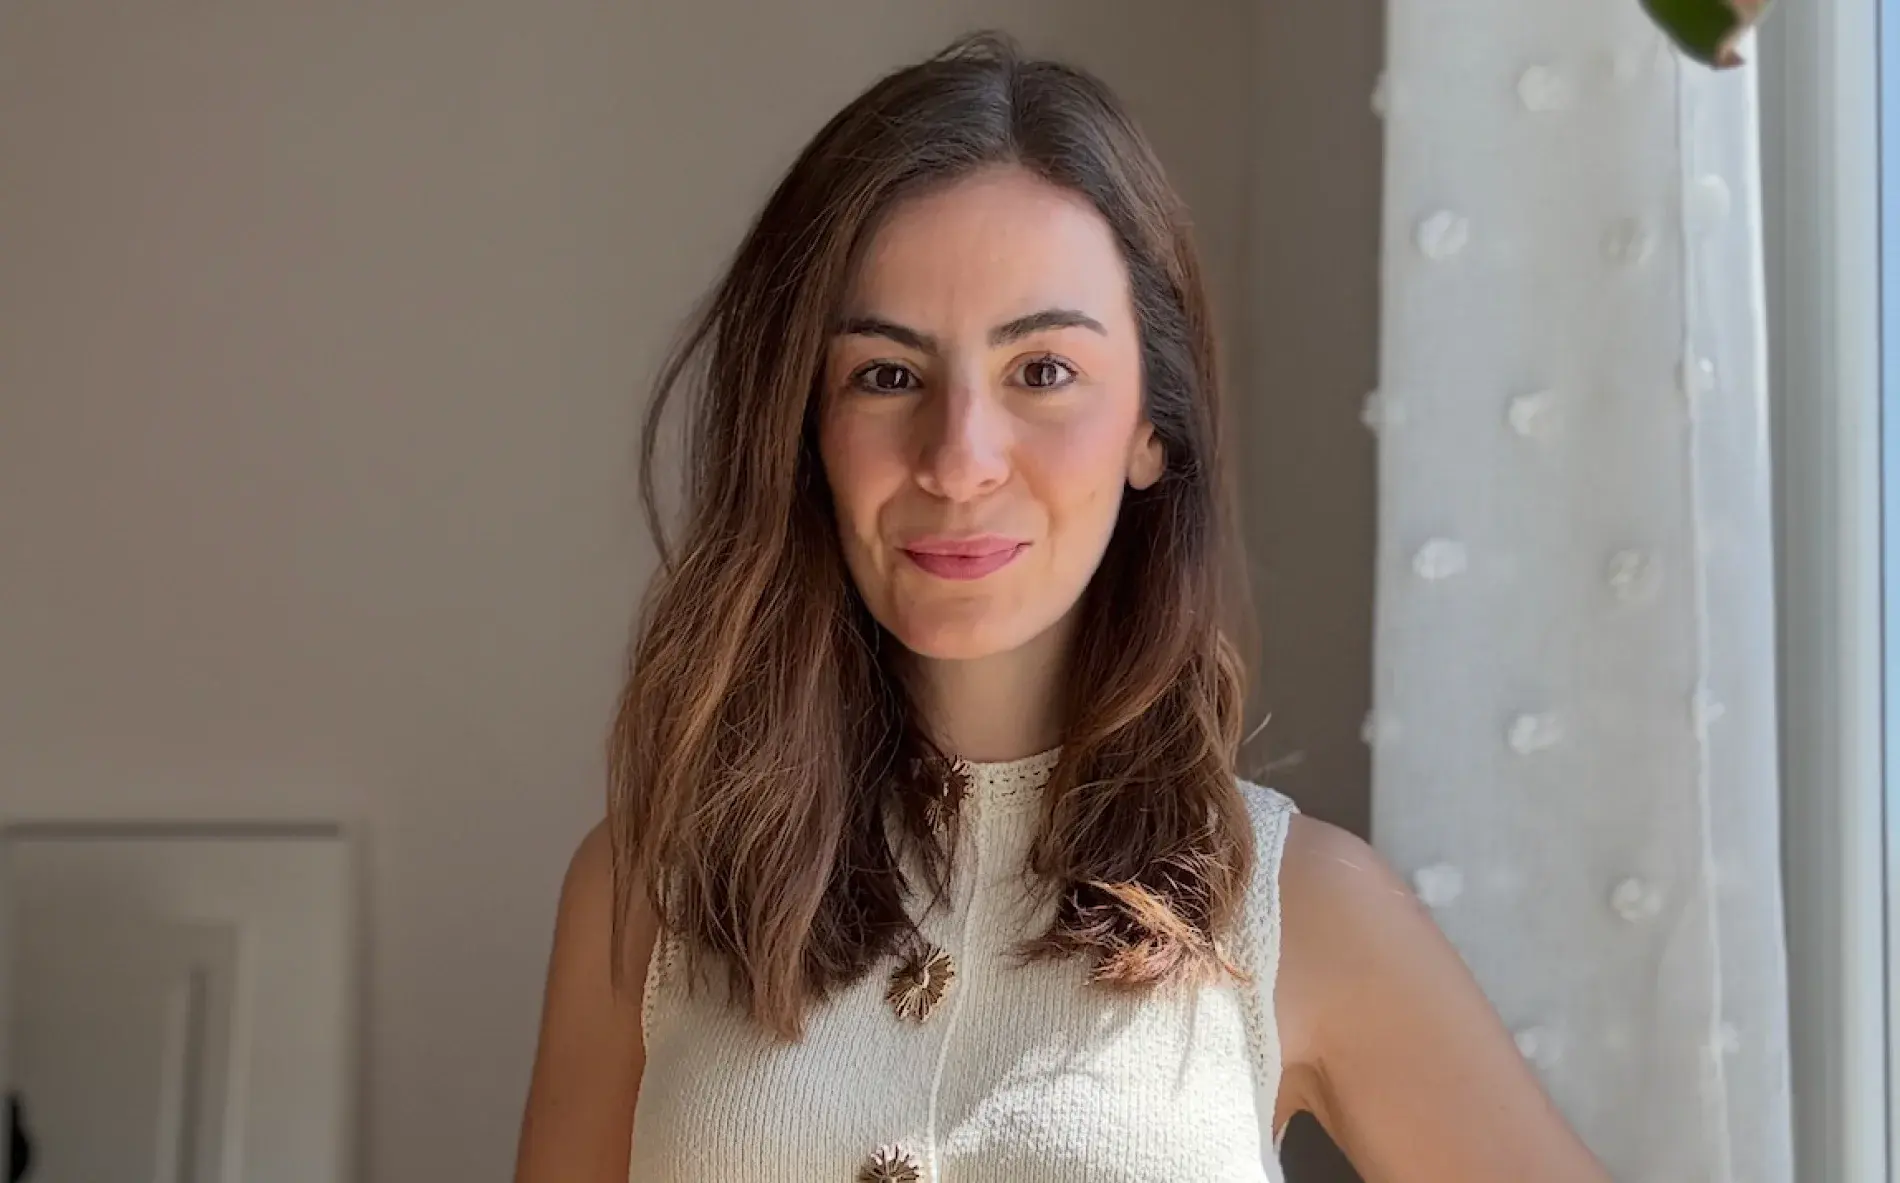
Data Visualization in Digital Product, with Núria Monmany
In this new episode of Solublabla Podcast we answer, with Núria Monmany, designer of digital products and experiences at Soluble, the question: How do you create a differentiated experience in digital product through data visualization?
And she's the guest because over recent months this question has come up many, many times to tackle the Barcelona Activa challenge. With the Talent Map we faced the challenge of displaying in a differentiated way 1.8 million data points extracted from LinkedIn that reflected the temperature and cycle of the talent ecosystem in the city.
About Barcelona Activa, the Talent Map, its working process and, above all, how she found impactful solutions for the project, our Barcelona Activa partners and the rest of Soluble, we discuss in these 15 minutes.
Want to know more? Pick your favorite platform and hit play.
And hit follow so you don't miss the next episode.
If you enjoyed the conversation, you'll definitely love the project case study.
To send us any questions, you can email us at hello@solublestudio.com
You can also visit solublestudio.com to access more content or follow us on our social networks Instagram, Twitter and LinkedIn.
Want us to send it straight to your inbox? Subscribe to our newsletter and we'll send you a roundup of the best content every two weeks.